Water Years and Picks
The second section of the Recharge Analysis page divides the record into water years and picks the trough and peak in each one. The app picks them automatically, as described in The WTF Method. Every pick can be checked and moved by hand in the year editor.
The water year
Water year starts in sets the calendar month each water year begins. It defaults to the usual low found in the seasonality check, shown as "(auto, the usual low)". Change it if you know the region's hydrology calls for a different start. The analysis uses complete water years only, so a partial year at either end of the record is left out. Water years are named by the calendar year they start in: for the Northern Midwest Aquifer System, water year 2004 runs from March 2004 to February 2005.
Changing the start month moves every water year, so it clears any picks you have set by hand. Reset all picks clears them without changing the start month.
The overview chart
The chart shows the whole filled series with each year's picks:
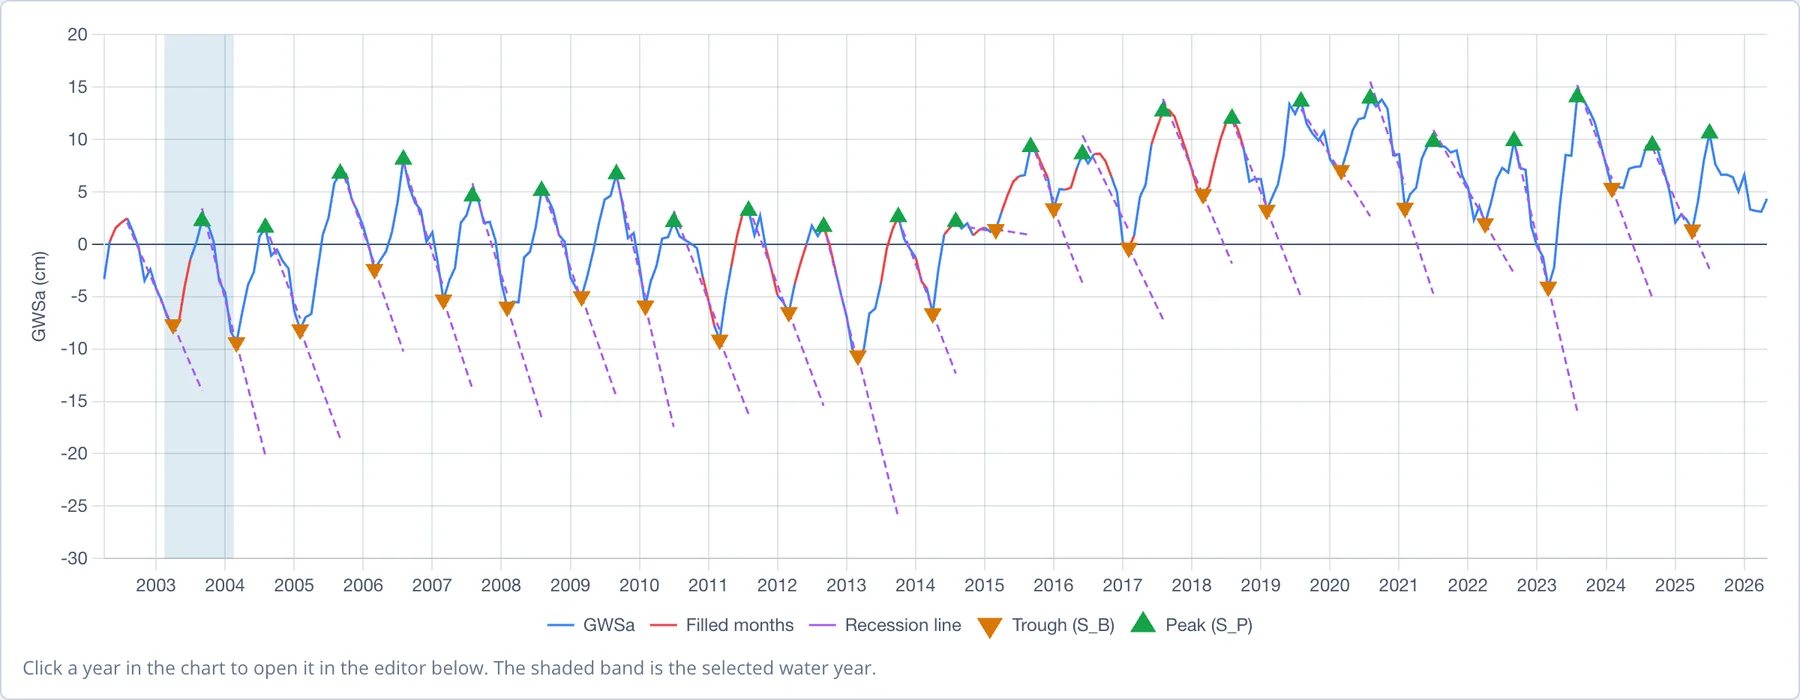
- the observed GWSa in blue, and the filled months in red, so a pick on an estimated month stands out
- each trough (SB) as an orange ▼ and each peak (SP) as a green ▲
- each year's recession line in purple, fitted from the previous peak to the trough and carried on to the month of the peak
A glance down the chart shows whether the picks follow the cycle: one ▼ at the bottom of each dip and one ▲ at the top of the following rise. The shaded band marks the water year open in the editor. Click anywhere in another year to open it.
The year editor
The editor below the chart shows one water year close up, with the months that set its recharge:
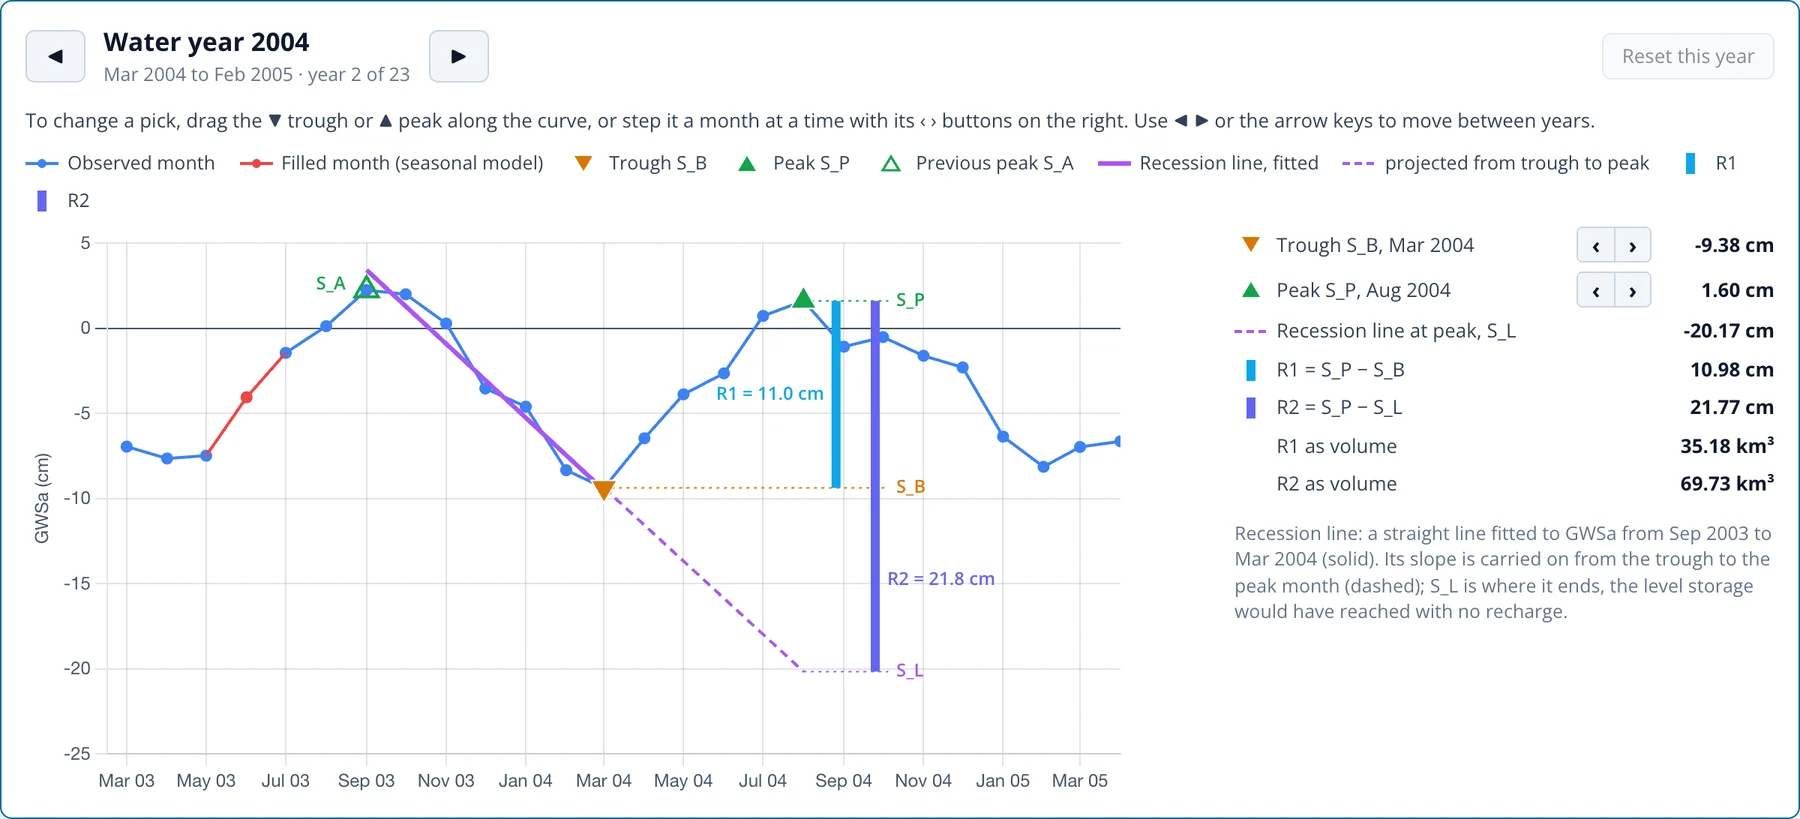
The chart starts at the previous year's trough, so it shows the previous year's rise to SA, the recession from SA down to this year's trough, and this year's rise to the peak. The legend above it lists every mark:
| Mark | Meaning |
|---|---|
| Blue line and dots | observed months |
| Red line and dots | months filled by the seasonal model |
| Orange ▼, S_B | this year's trough |
| Green ▲, S_P | this year's peak |
| Hollow green △, S_A | the previous peak, where the recession line starts |
| Solid purple line | the recession line, fitted to GWSa from S_A to the trough |
| Dashed purple line | the recession line carried on from the trough to the month of the peak, ending at S_L |
| Light blue bar | R1, from S_B up to S_P |
| Purple bar | R2, from S_L up to S_P |
Dotted guides carry SP, SB and SL across to the bars, so you can see which levels each estimate spans. The panel on the right lists the trough and peak with their months and values, SL, R1 and R2 in cm and, for a region, as volumes in km³. A note below the values gives the months the recession line was fitted over, and the table notes for the year (see Results).
In water year 2004 the trough falls in March 2004 at −9.38 cm and the peak in August 2004 at 1.60 cm, so R1 is 10.98 cm. The recession line is fitted from the September 2003 peak (SA) to the March trough. Carried on to August, it reaches SL = −20.17 cm, so R2 is 21.77 cm. Over the 320,368 km² of the aquifer system, that is 35.2 km³ (R1) to 69.7 km³ (R2) of recharge.
The first water year has no previous peak. Its SA is the highest month before its trough, after the long-term trend is removed.
Moving through the years
◀ and ▶ on either side of the year's title step to the previous and next water year, as do the ← and → arrow keys. The title shows the months the water year covers and its place in the record ("year 2 of 23"). Clicking a row in the results table also opens that year.
Changing a pick
Check each year's trough and peak. A pick can be wrong when a noisy month, often a spike in the GRACE data or a filled month, is higher or lower than the true turning point. There are two ways to move a pick:
- Drag the ▼ trough or ▲ peak along the curve. The marker snaps to months as you drag, and the year is recalculated when you let go.
- Step it one month at a time with the ‹ and › buttons beside the trough or peak in the panel on the right.
The picks are limited to the months the method allows. The peak stays within its water year and after the previous year's peak. The trough stays between the previous peak and this year's peak. A step button is disabled when the next month would break these limits.
Moving a pick recalculates the whole analysis. A peak sets SA for the following year, so moving a peak also changes the next year's recession line, R2 and possibly its trough. Years with a hand-set pick are marked with ✎ in the results table and "set by hand" in its notes. Reset this year returns a year to the automatic picks, and Reset all picks does the same for every year.
Hand-set picks last until you close the page. To keep them, download the CSV, which records the picks and marks the ones set by hand.