Gaps in the Record
Missing months
The GRACE record is missing 35 months: scattered single months, mostly between 2011 and 2017, and the 11 months between the end of GRACE and the start of GRACE-FO (see The GRACE Mission). TWSa and GWSa have gaps in those months. The GLDAS layers (SMa, SWEa and CANa) come from land surface models that run every month, so they have no gaps.
Trend analysis in the app skips missing months. Analyses that work year by year need a value for every month. In the Recharge Analysis, for example, a missing month at a seasonal peak or trough changes that year's result. The app estimates the missing months with a seasonal model, following the approach of Barbosa et al. (2022). This page shows the options in the app, and The Seasonal Model gives the method: the model, how it is fitted, how the filled values are computed, and how accurate they are.
The Gap filling control
The Gap filling control in the panel sets what the chart does at the missing months:
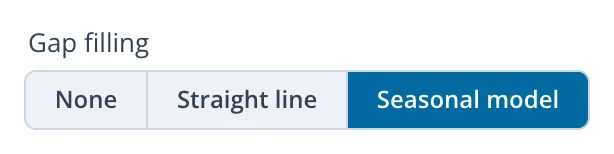
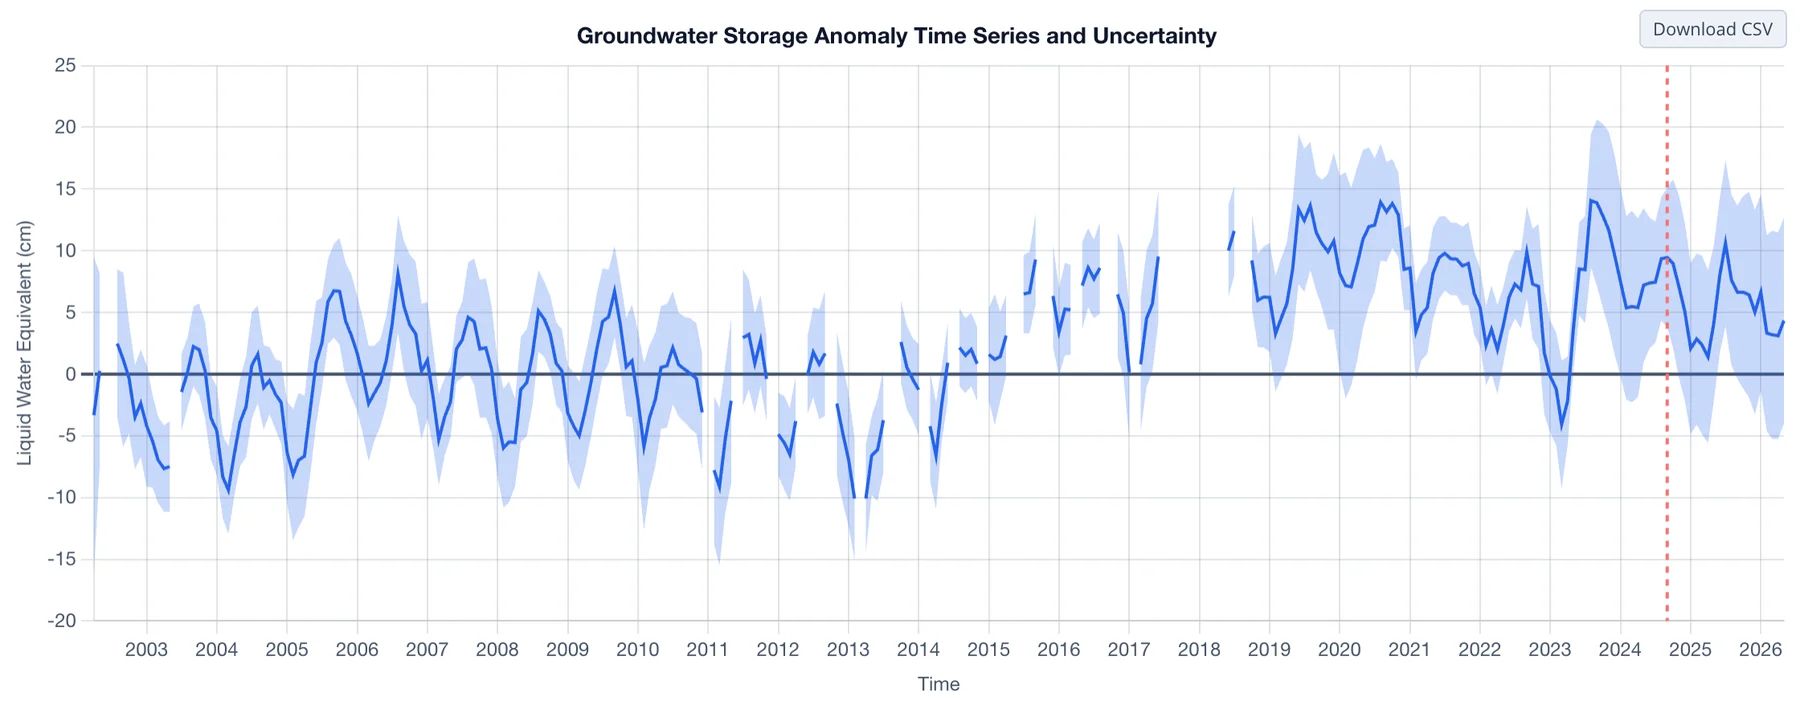
- None breaks the line at every gap, so you can see exactly which months were observed.
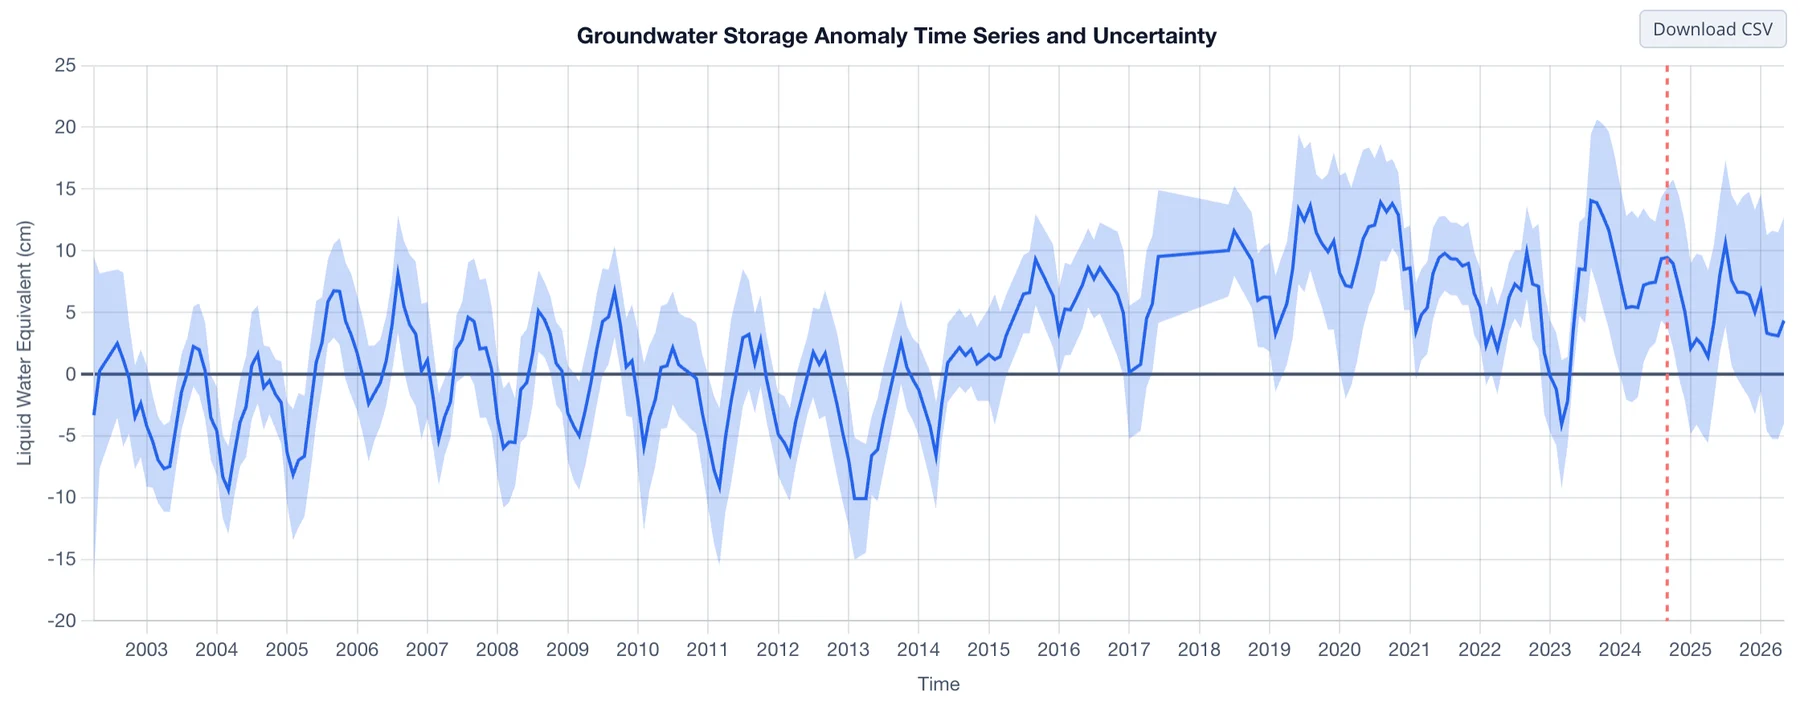
- Straight line joins the months on either side of each gap. It only bridges the gap on the chart and estimates nothing.
- Seasonal model estimates each missing month from a trend and seasonal cycle fitted to the observed months. Filled months are drawn as a dashed line with open markers, and hovering over one shows its value. This option also adds the Recharge Analysis button above the chart (see Opening the Analysis).
The Northern Midwest Aquifer System, which has a strong seasonal cycle, shows the difference between the three options. With None:
With Straight line, the 11 months between the missions become a flat bridge:
With Seasonal model, the filled months carry on the region's annual cycle:
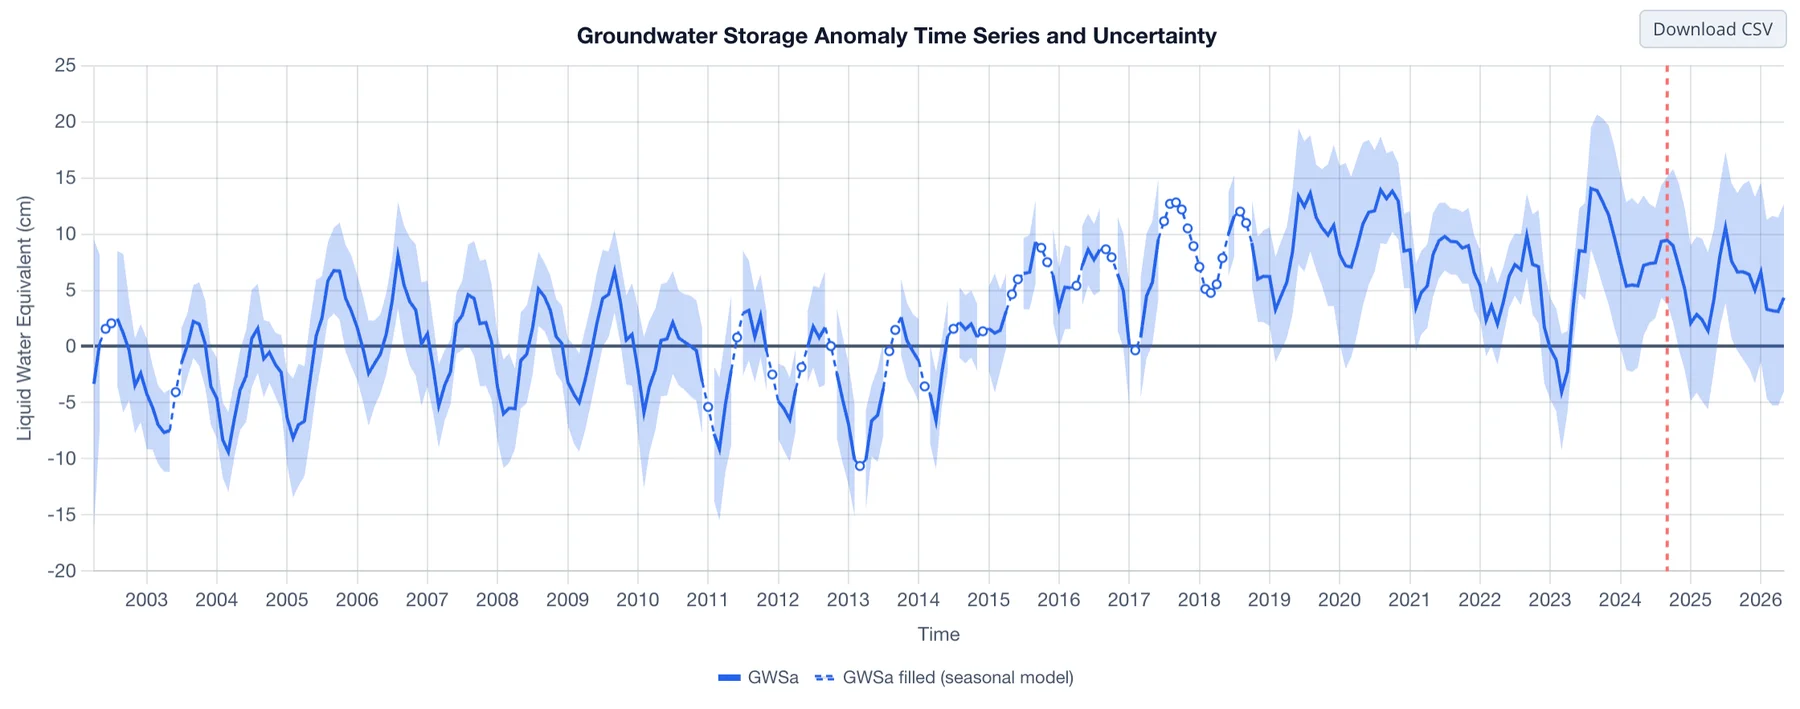
The uncertainty band is not drawn for filled months, because the error of a filled value comes from the model rather than from GRACE (see Fill accuracy).
Filled values in the CSV
The downloaded CSV always includes the filled values, in the GWSa_filled and TWSa_filled columns, with GWSa_is_filled and
TWSa_is_filled marking the filled months, whichever option the chart uses (see Downloading Data).
Reference
Barbosa, S. A., Pulla, S. T., Williams, G. P., Jones, N. L., Mamane, B., and Sanchez, J. L. (2022). Evaluating groundwater storage change and recharge using GRACE data: A case study of aquifers in Niger, West Africa. Remote Sensing, 14(7), 1532. doi:10.3390/rs14071532