California's Central Valley: correcting GRACE with well data
Paper
Stevens, M. D., Ramirez, S. G., Martin, E.-M. H., Jones, N. L., Williams, G. P., Adams, K. H., Ames, D. P., and Pulla, S. T. (2025). Groundwater storage loss in the Central Valley analysis using a novel method based on in situ data compared to GRACE-derived data. Environmental Modelling & Software, 186, 106368. doi:10.1016/j.envsoft.2025.106368
Setting
California's Central Valley is about 700 km long and 80 km wide, about 52,000 km², and one of the most heavily pumped aquifer systems in the world. It is narrower than a single 3° GRACE mascon (about 333 × 264 km at that latitude), and the pumping decline is concentrated in the valley while the surrounding mountains behave differently. That makes it a textbook case of leakage: averaged over the valley, GRACE understates the storage loss.
An independent estimate from wells
The study built a storage record from well data for 1960–2020:
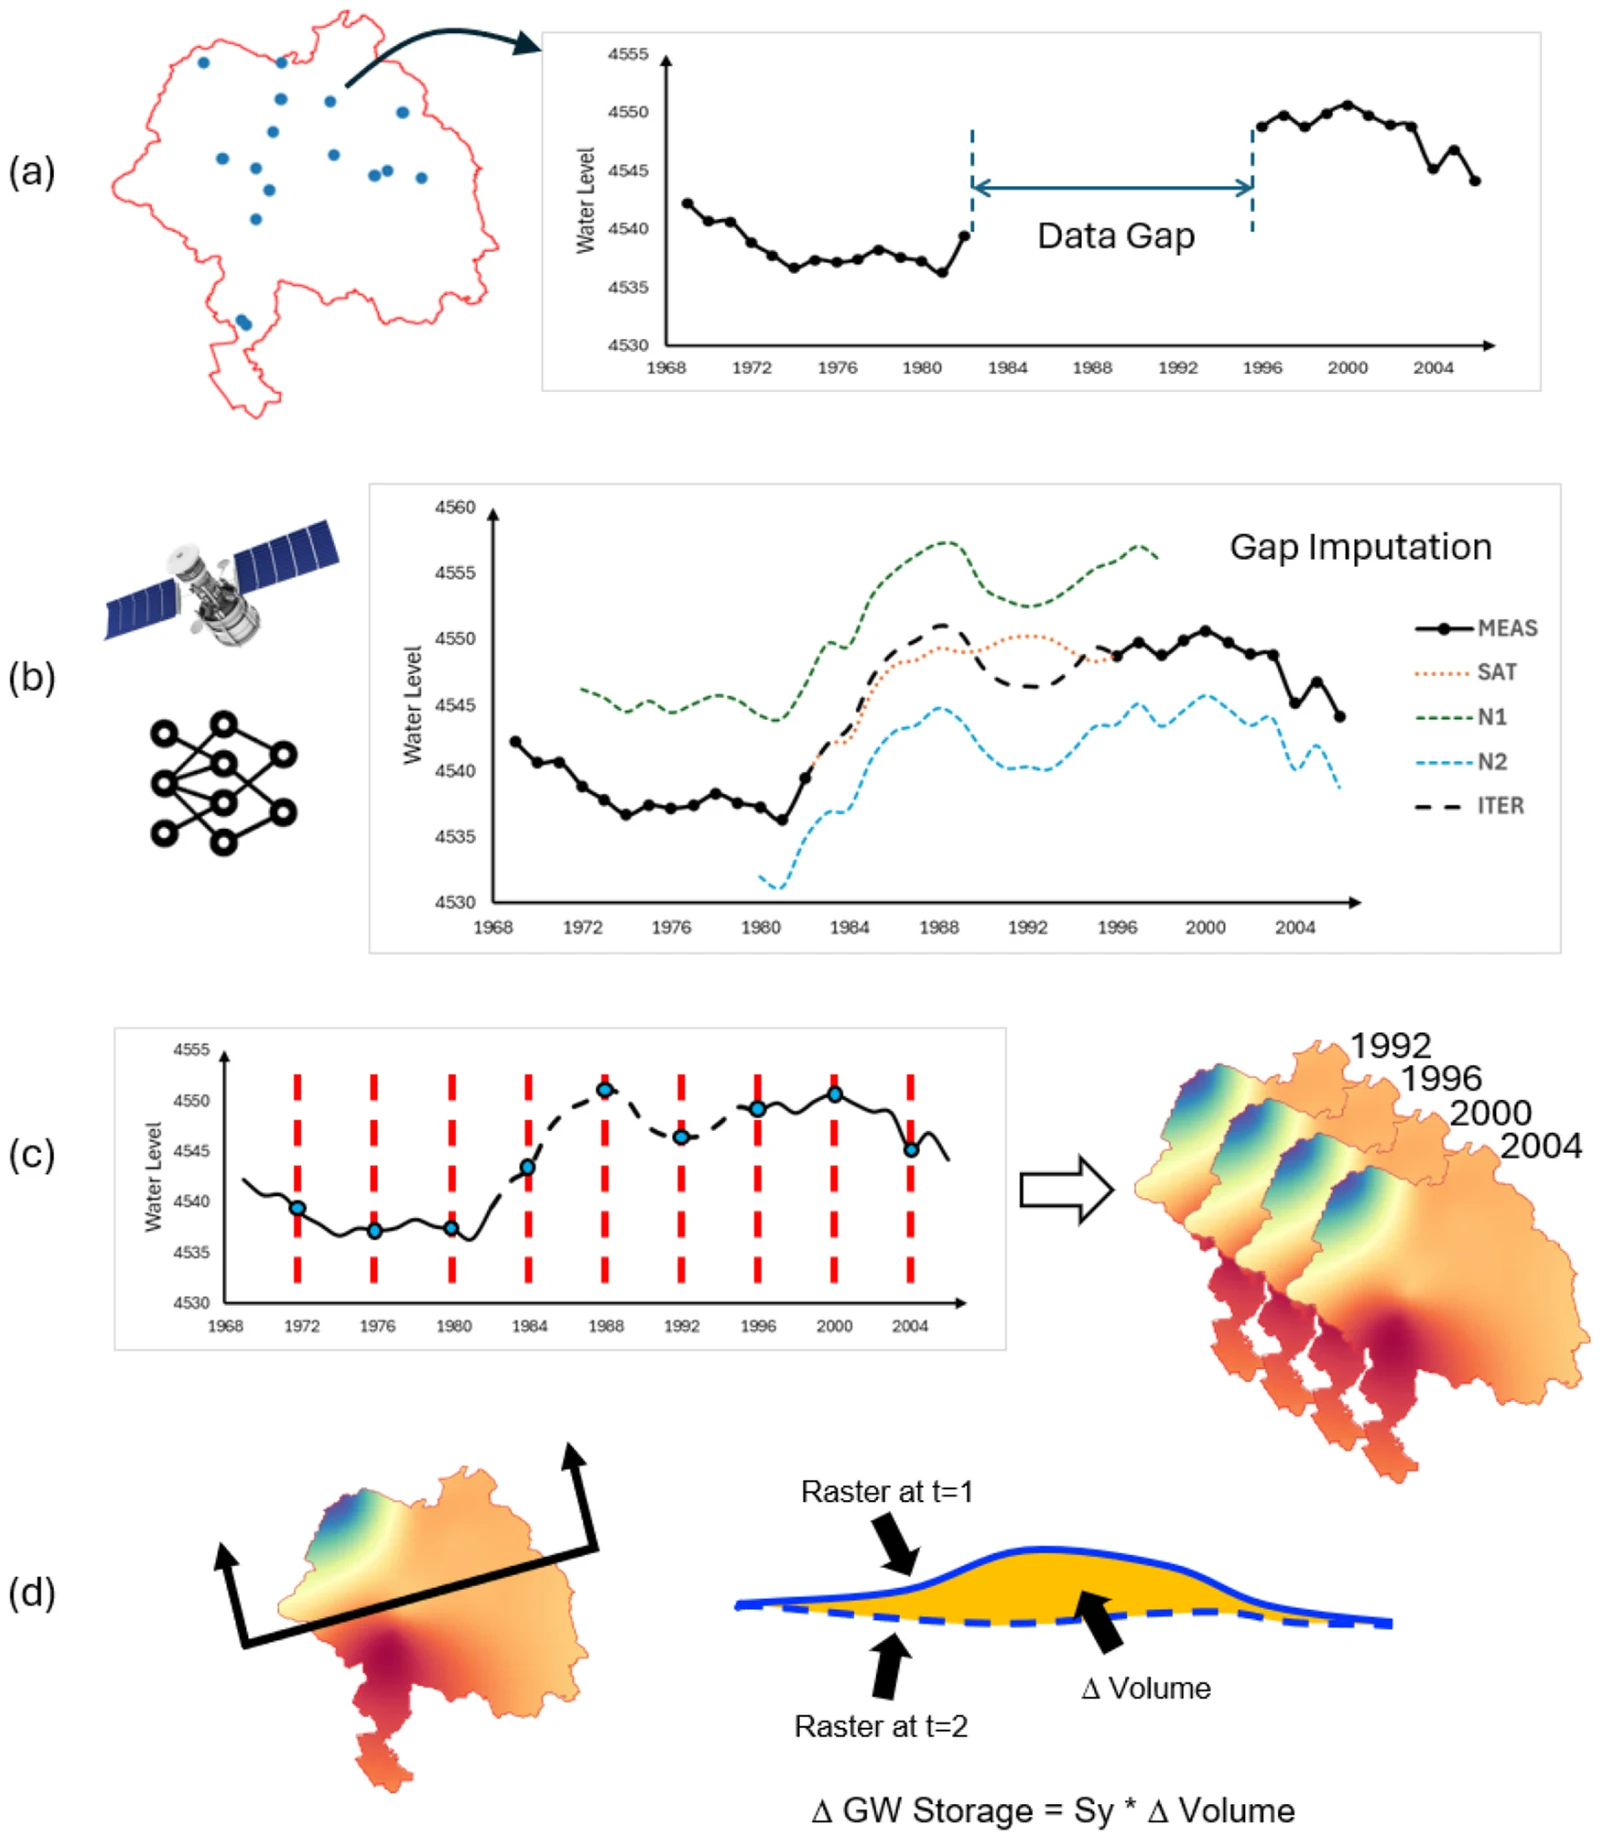
Groundwater storage analysis using in situ data. (a) wells with data gaps are identified, (b) data gaps are imputed using a multi-step machine learning algorithm featuring Earth observations, (c) temporal and then spatial interpolation is used to generate time-varying water level rasters, (d) water levels rasters are combined with storage coefficients to estimate groundwater storage change at each time interval. Reprinted from Stevens et al. (2025), Fig. 3, © 2025 Elsevier, reused under the authors' rights.
- Wells from USGS and California Department of Water Resources databases were screened by record length; the study compared thresholds of 150, 75 and 50 months with observations (181, 572 and 921 wells).
- Gaps in each well's record were filled in two steps: a machine learning model (an extreme learning machine) driven by the Palmer Drought Severity Index and GLDAS soil moisture, then an iterative refinement using the three best-correlated neighboring wells.
- The filled records were kriged into monthly water level surfaces on a 0.1° grid.
- Changes in water level were converted to changes in storage with the specific yield map of the USGS Central Valley Hydrologic Model (CVHM).
Using the 75-month threshold, the well-based storage curve matched CVHM closely (r² = 0.87, RMSE 9.04 km³).
Calibrating GRACE
The GRACE GWSa for the valley, converted to volume, tracked the well-based curve in timing but was much smaller. Multiplying it by a scale factor corrected for the leakage. The best factor was about 5 (± 1.0); with it, GRACE and the wells agreed with r² = 0.725, a mean error of −14.4 km³ and an RMSE of 21.2 km³ over 2002–2021.
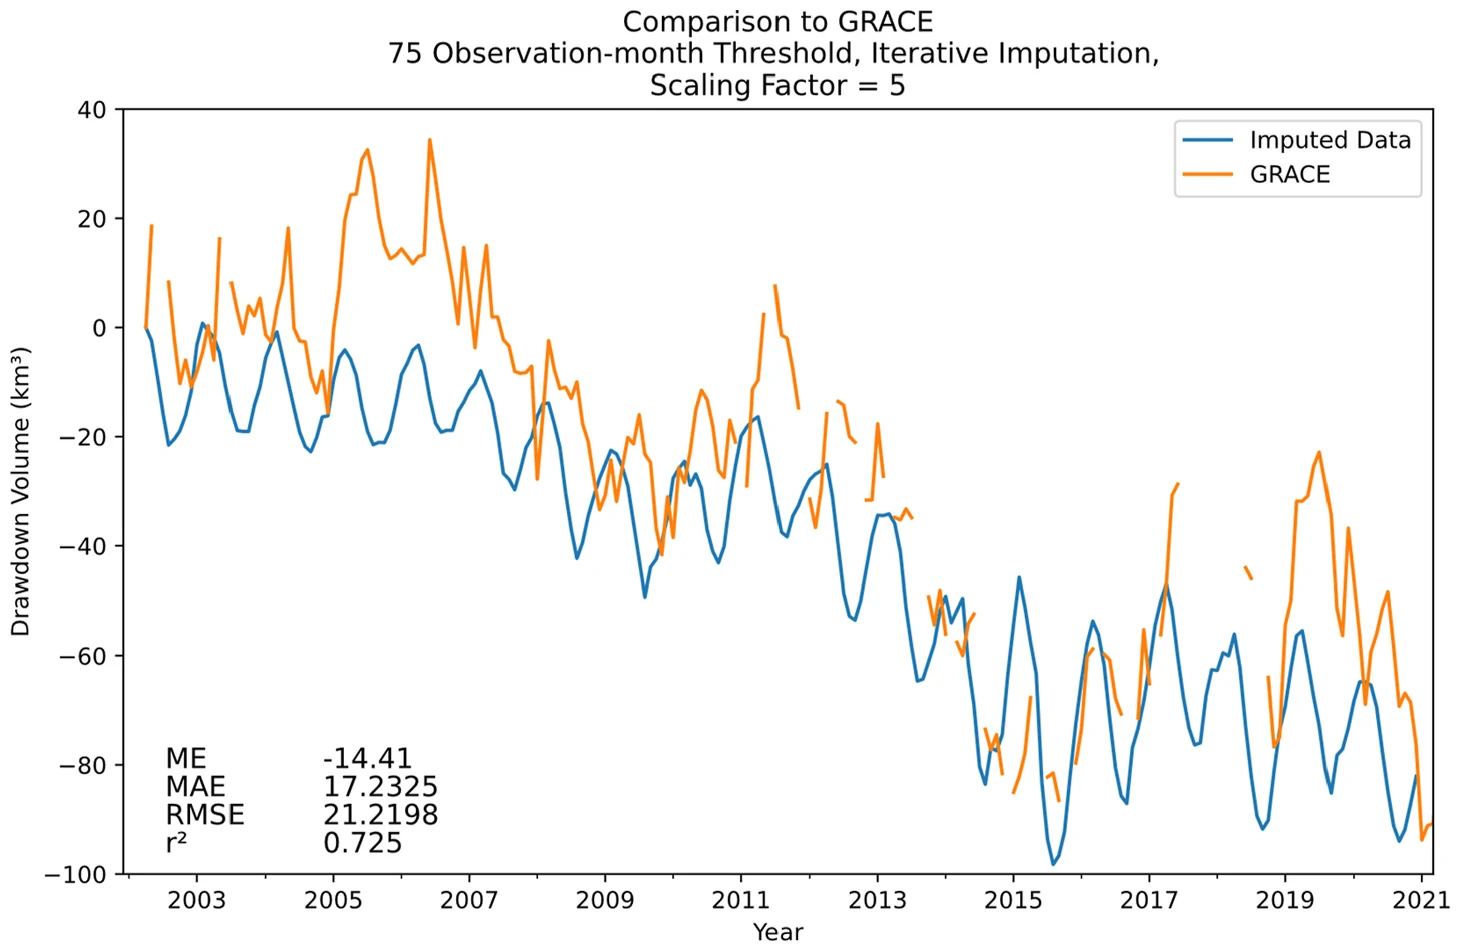
Comparison of Iterative Well Imputation to GRACE using 75 observation-month threshold dataset. Reprinted from Stevens et al. (2025), Fig. 11, © 2025 Elsevier, reused under the authors' rights.
With the factor applied, the GRACE storage losses agree with most published estimates for the same periods:
| Published study | Period | Published loss | GRACE × 5 in this study |
|---|---|---|---|
| Famiglietti et al. (2011) | Oct 2003 – Mar 2010 | 20.3 km³ | 26.7 km³ |
| Scanlon et al. (2012) | Oct 2006 – Mar 2010 | 31 km³ | 31.1 km³ |
| Xiao et al. (2017) | Apr 2002 – Sep 2016 | 64.6 km³ | 70.7 km³ |
| Ojha et al. (2018) | Dec 2006 – Jan 2010 | 21.3 km³ | 53.2 km³ |
Conclusions
- Gap-filled well records can produce a storage history that agrees with a calibrated regional groundwater model.
- That history gives a direct way to calibrate a leakage scale factor for GRACE, about 5 for the Central Valley.
- Once calibrated, GRACE can track storage change in the valley going forward, and the same approach could be used in data-poor regions with some well records.
For app users: for a small or narrow aquifer, the GRACE average from the app captures the timing and direction of storage change but can understate its size several times over. A scale factor calibrated against wells corrects that, for that aquifer only.