Global View
The global view
Click Global to see the displayed layer for every land cell in the world. The first time you open it, the app downloads the whole record for that layer, which can take a little while; after that it is cached in your browser.
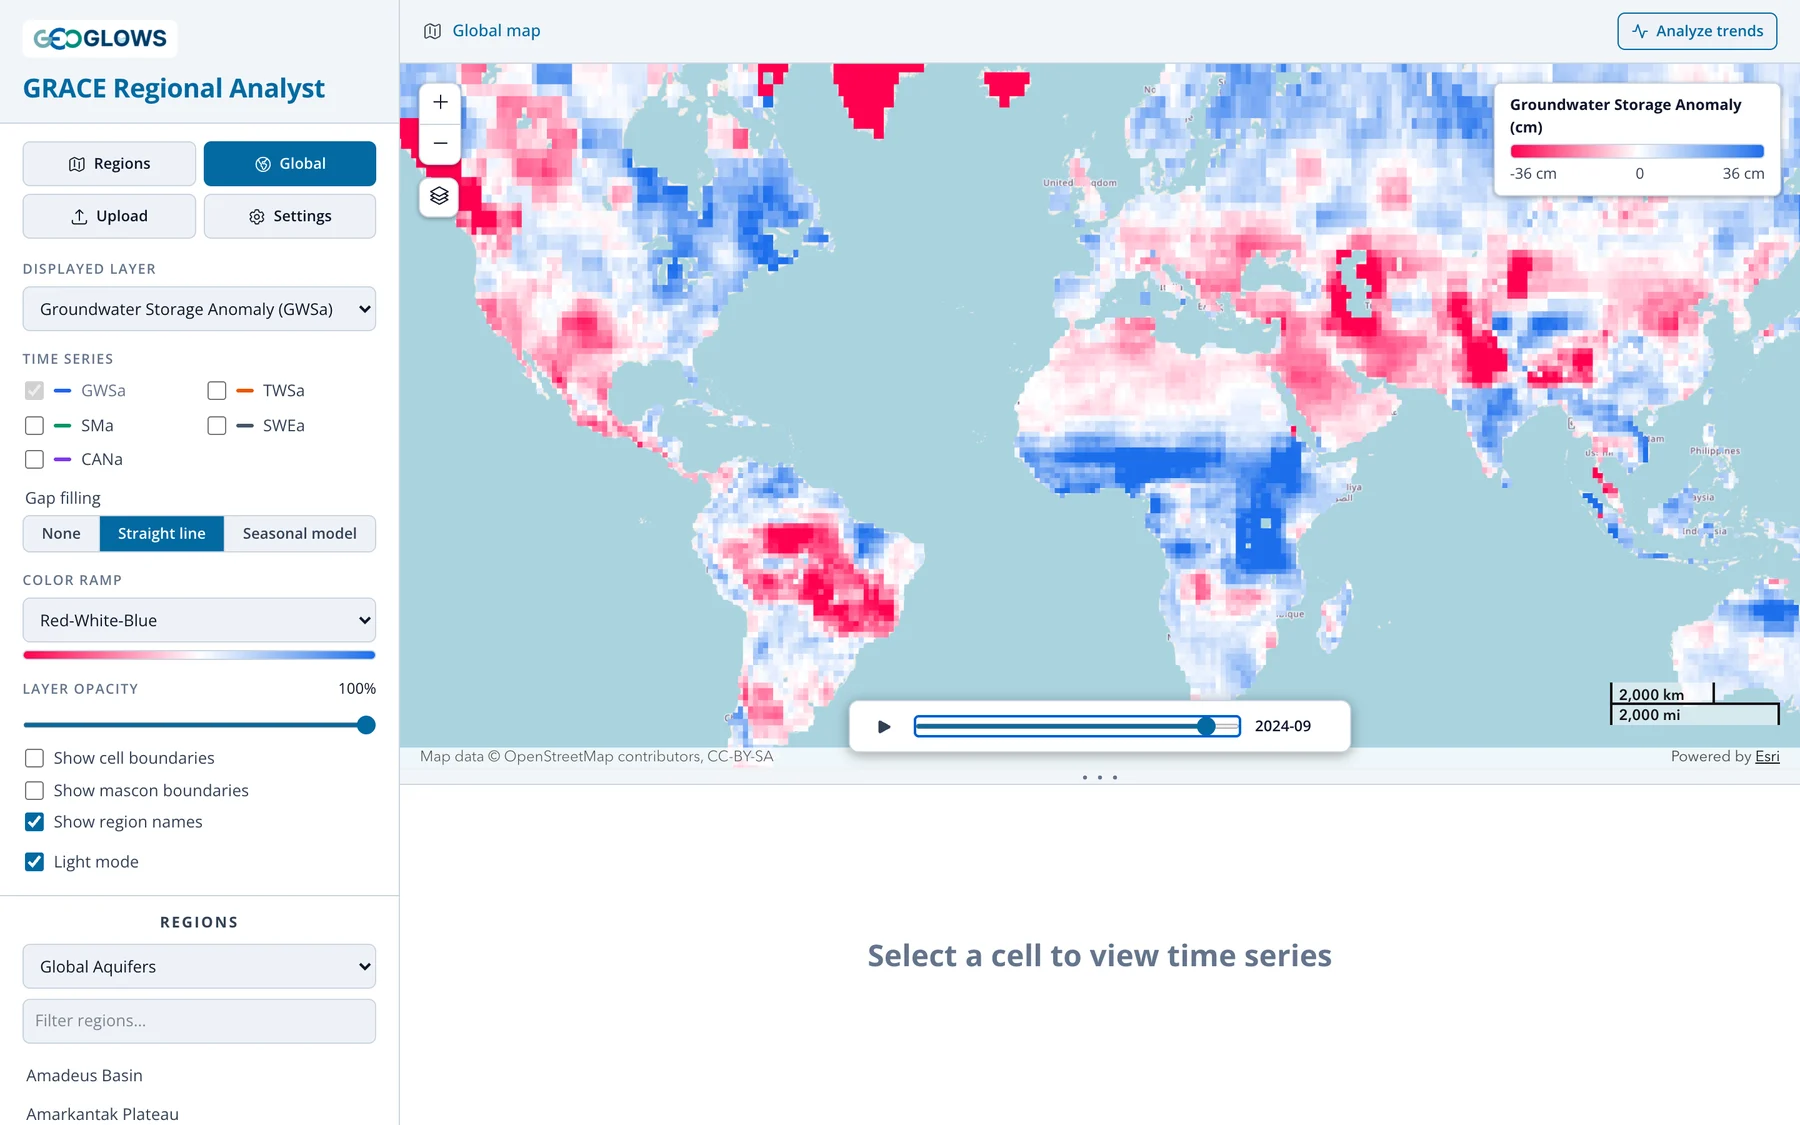
Press play on the time control to animate the record month by month. The global view plays faster than the regional view, about four months a second, and loops back to the start. The animation makes the big patterns easy to spot: the steady decline across northern India, the Middle East and the North China Plain, the rising storage across the Sahel since about 2010, and the wet and dry years that sweep across the Amazon and southern Africa.
Change the Displayed layer to compare components. TWSa shows the blocky outline of the 3° mascons (see The GRACE Mission); SWEa is near zero everywhere except at high latitudes and in mountains; SMa shows the seasonal wetting and drying of soils.
Time series for a single cell
Click any land cell to plot its time series. The breadcrumb changes to the cell's coordinates, and the chart shows the cell's values with the ±1σ uncertainty band. The chart works as it does for a region (see Regional View), and the CSV download for a cell is named after its coordinates.
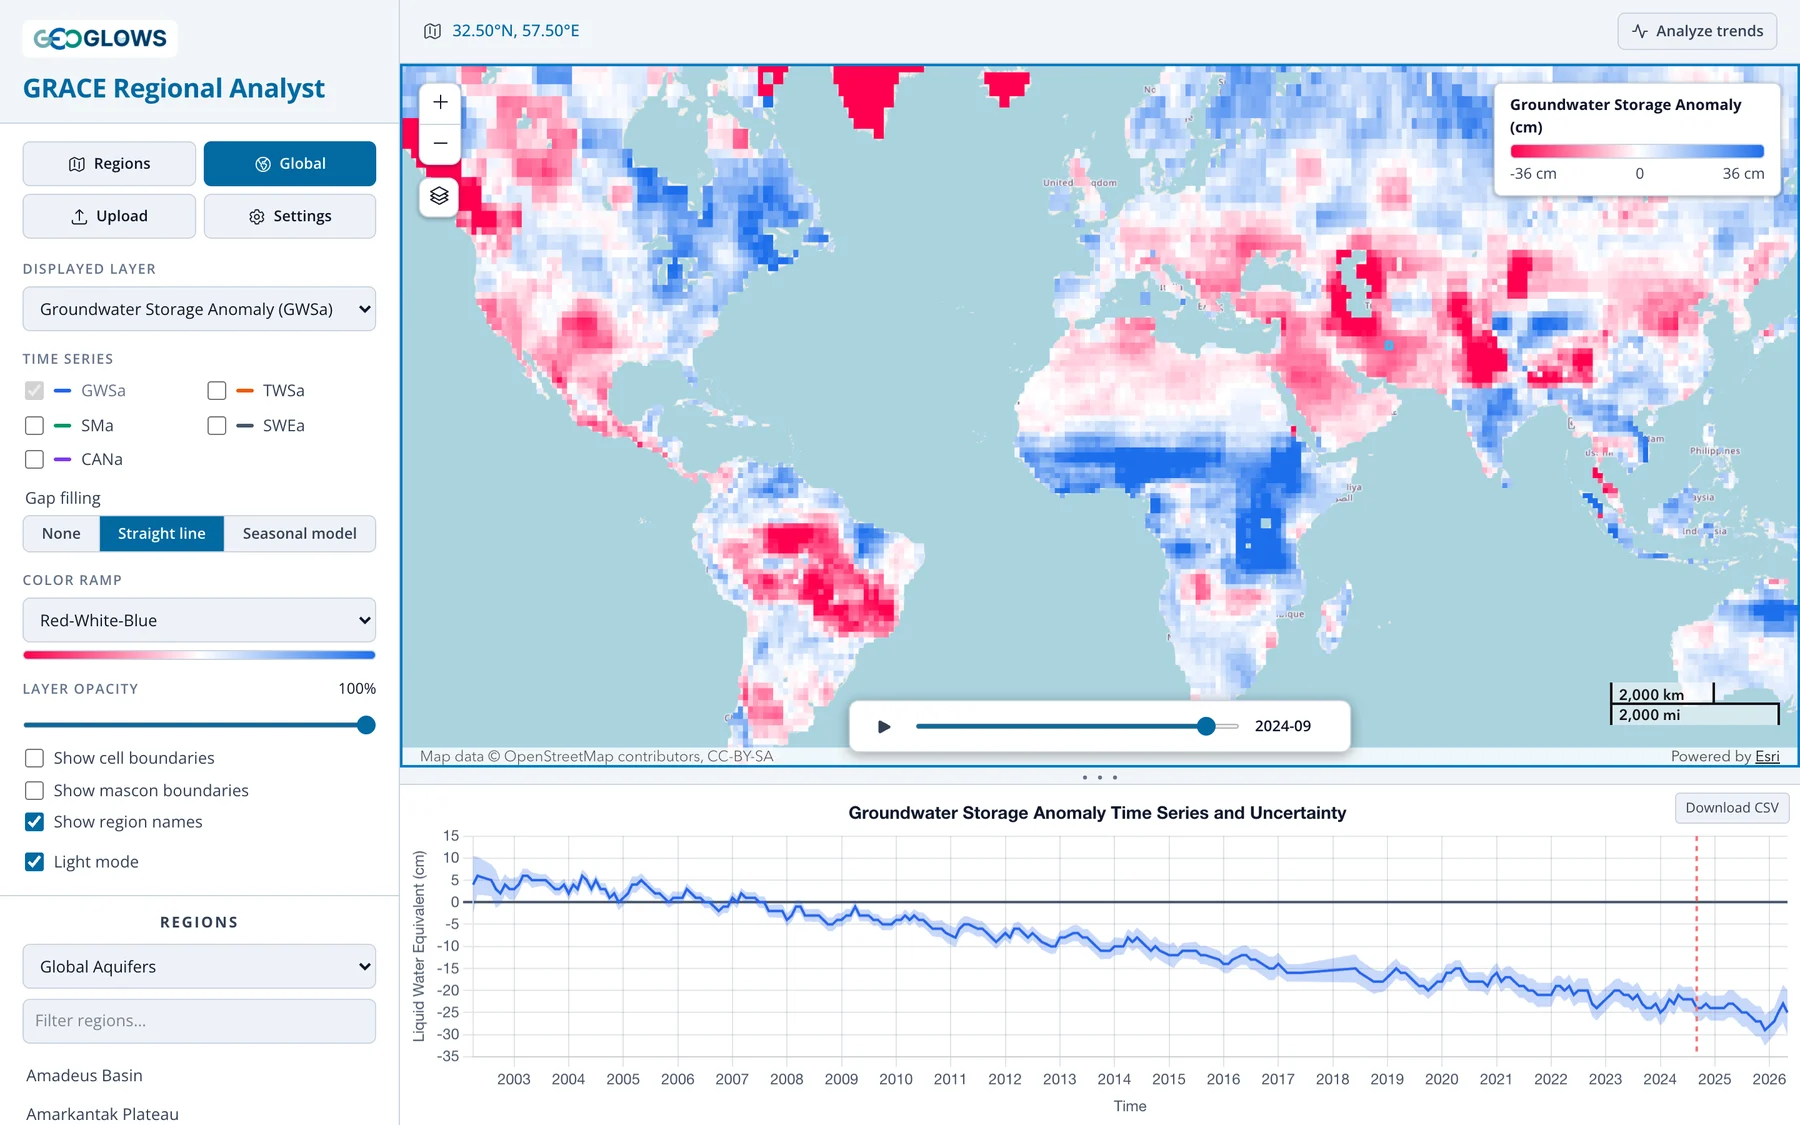
A single cell is quick to look at, but remember that GRACE resolves about 3°, so the cell's TWSa is shared with its neighbors in the same mascon. For a basin or aquifer, use the regional view, which averages over all the cells in the region.
Trend map
With trends turned on, the global view colors each cell by its trend in place of the monthly anomaly, and the animation is hidden. The legend counts the cells in each class.
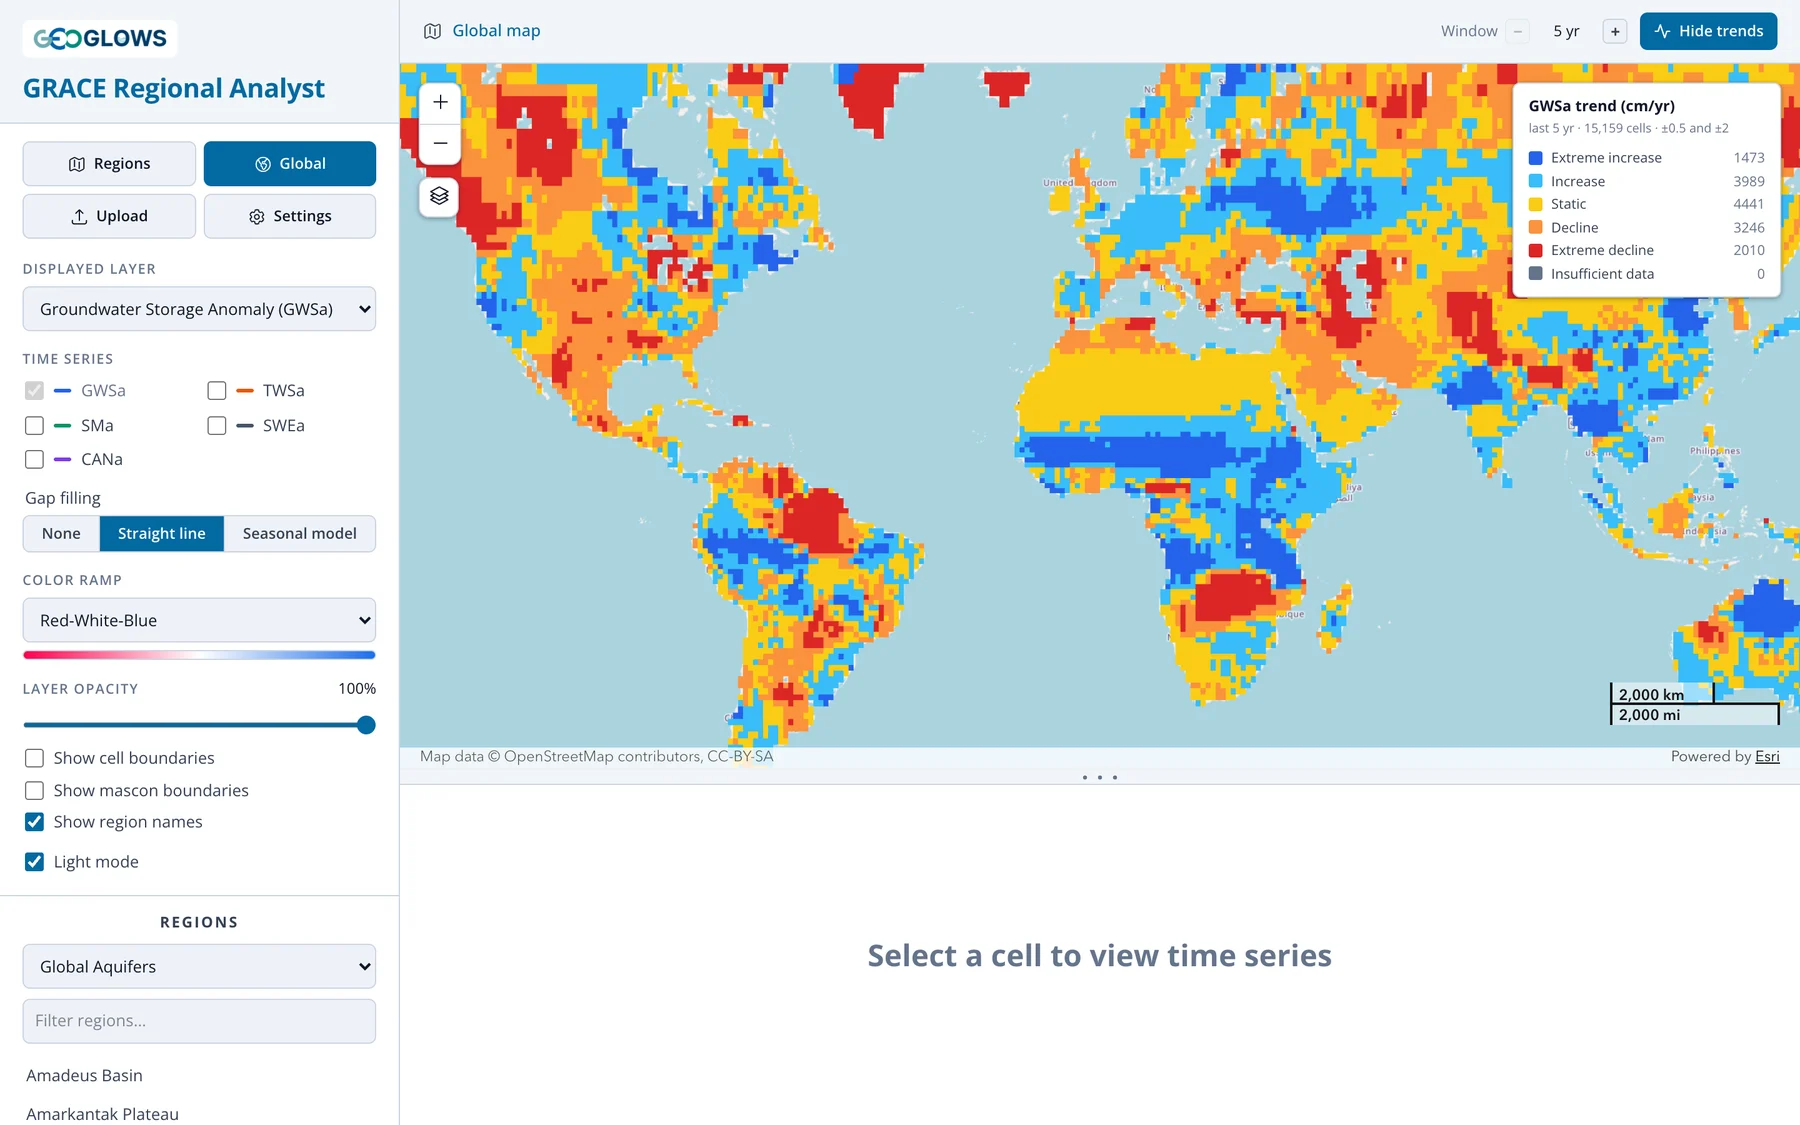
See Trend Analysis for how the trend is computed and how to choose the window.