Using the GEOGLOWS Global HydroViewer
The GEOGLOWS Global HydroViewer is a tool for visualizing and accessing streamflow forecasts and historical data across the globe. This web-based application allows users to explore real-time streamflow conditions, analyze forecast trends, and review hydrological simulations for any river, helping decision-makers and researchers better understand water-related challenges. With easy-to-use visualization tools, users can assess discharge values and identify potential flood or drought risks. The HydroViewer supports informed decision-making in water resource management, disaster risk reduction, and climate resilience planning. Access the app at GEOGLOWS HydroViewer.
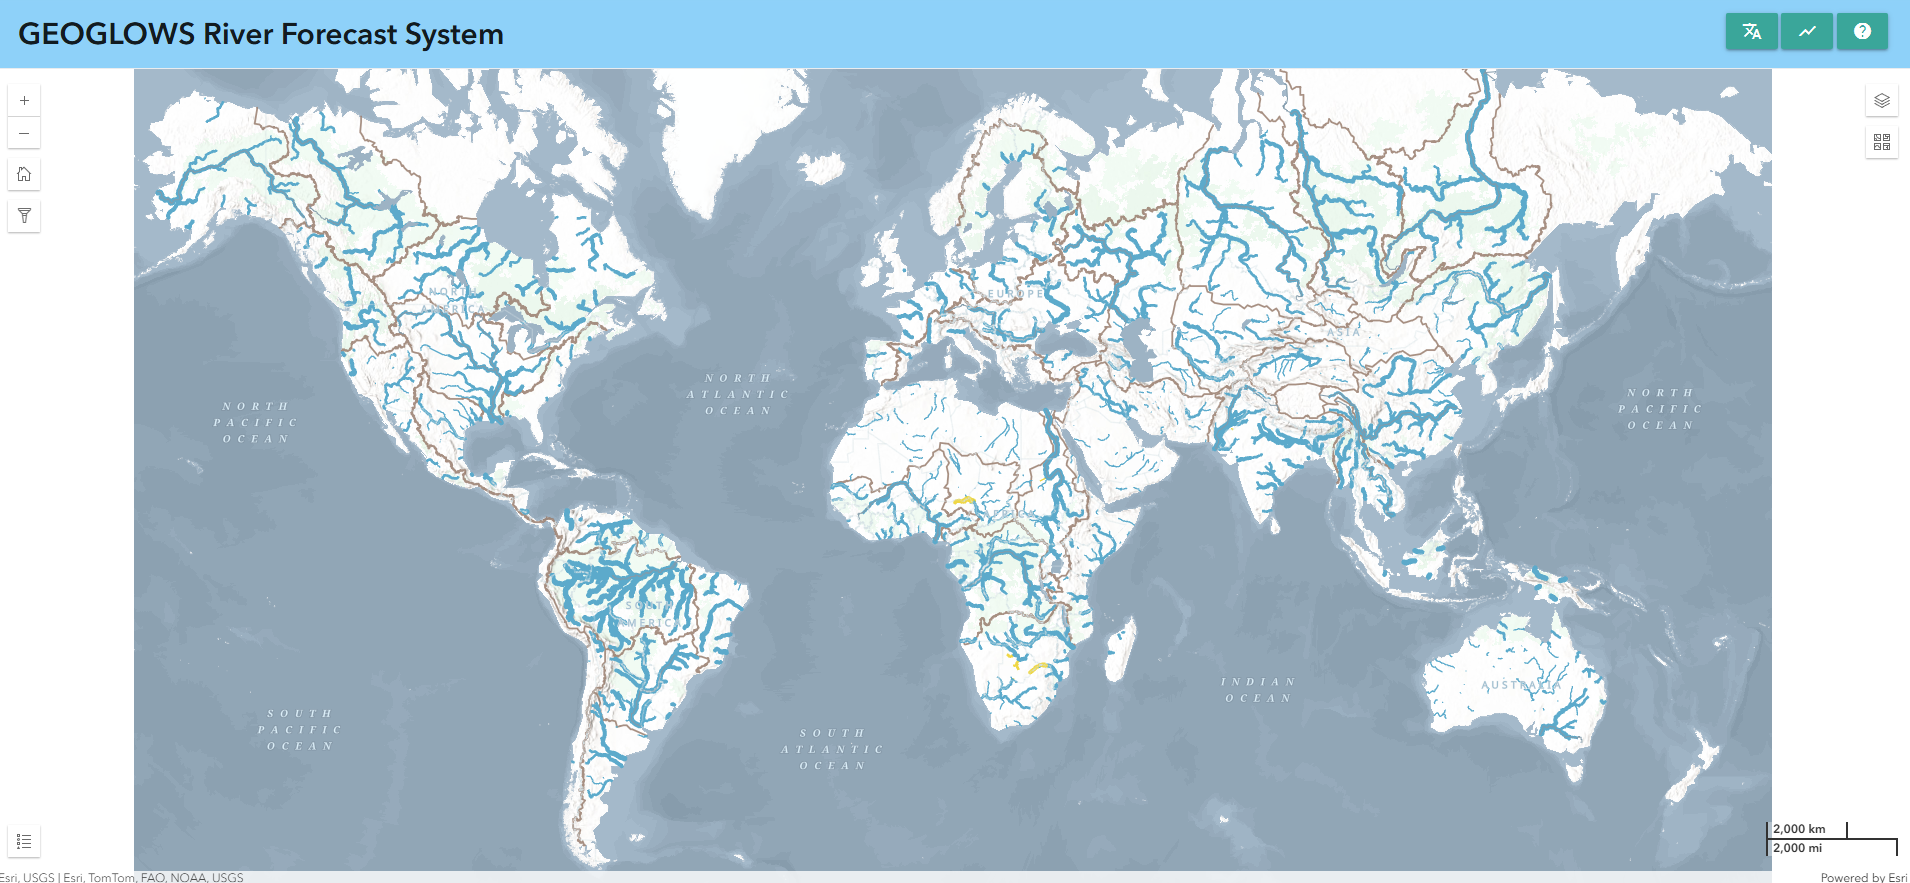
Stream Visualization
The HydroViewer highlights streams where flows are expected to exceed return periods, using the following color-coded legend:
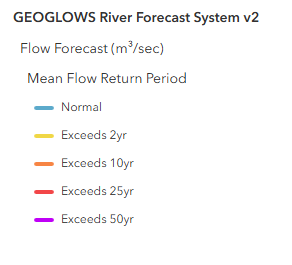
This allows users to quickly identify rivers experiencing high flows.
Map Features:
1. Zoom Levels:
- At the global level, only the largest streams are displayed.
- As users zoom in, more streams become visible within their area of interest.
2. Interactive River Selection:
- Clicking on a river displays retrospective and forecast data for that stream.
- The river ID is shown for easy reference.
3. Direct River ID Entry:
- If the river ID is known, users can directly enter it into the application to view the data.
Users can download plots and .csv files for streams of interest.
For detailed instructions on how to use the HydroViewer, refer to the presentation: GEOGLOWS HydroViewer Tutorial.pptx.