Forecast Data
The GEOGLOWS model produces ensemble streamflow forecasts using data from the ECMWF (European Centre for Medium-Range Weather Forecasts) ensemble system. Forecasts are produced daily and are available by 12 PM UTC. Similar to the retrospective data, the units are in cubic meters per second.
Each forecast includes a 50+1 member ensemble:
- 1 baseline (control) prediction
- 50 perturbations (slight variations) of the result
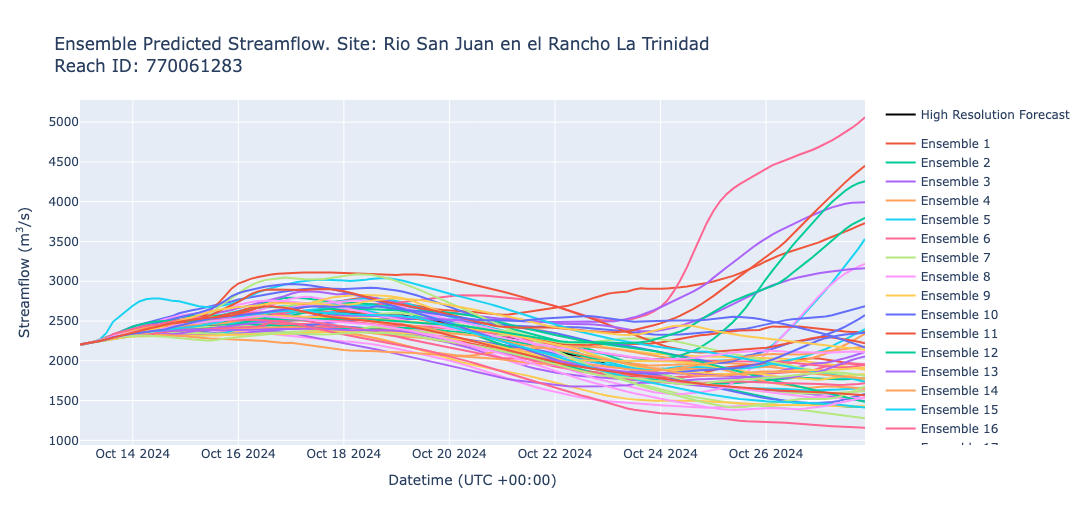
The forecast has a 3-hour time step, where each flow value represents the average flow that occurred in the river during the previous 3 hours. Below is an example graph showing all the ensemble members.
Ensemble Probabilities and Interpretation
Each ensemble member has an equal probability of occurring. Therefore, forecasts are best understood by looking at summaries of the ensembles rather than individual members.
Forecast plots are designed to help users interpret the range of possible outcomes and uncertainties. The most commonly used forecast plot includes the median, the 20th percentile, and the 80th percentile. These represent 60% of the probability distribution within the ensemble members and provide insight into the potential variability of future streamflows. This approach allows users to see the range of probable scenerios for their streams.
Interpreting Forecast Plots
The following graph shows an example of a forecast plot:
- Black Line: The median of the 51 ensemble members (the "best guess" of river flow at each 3-hour period)
- Blue Lines: The 20th and 80th percentile values
- Blue Shaded Area: Represents the middle 60% of values from the ensemble predictions
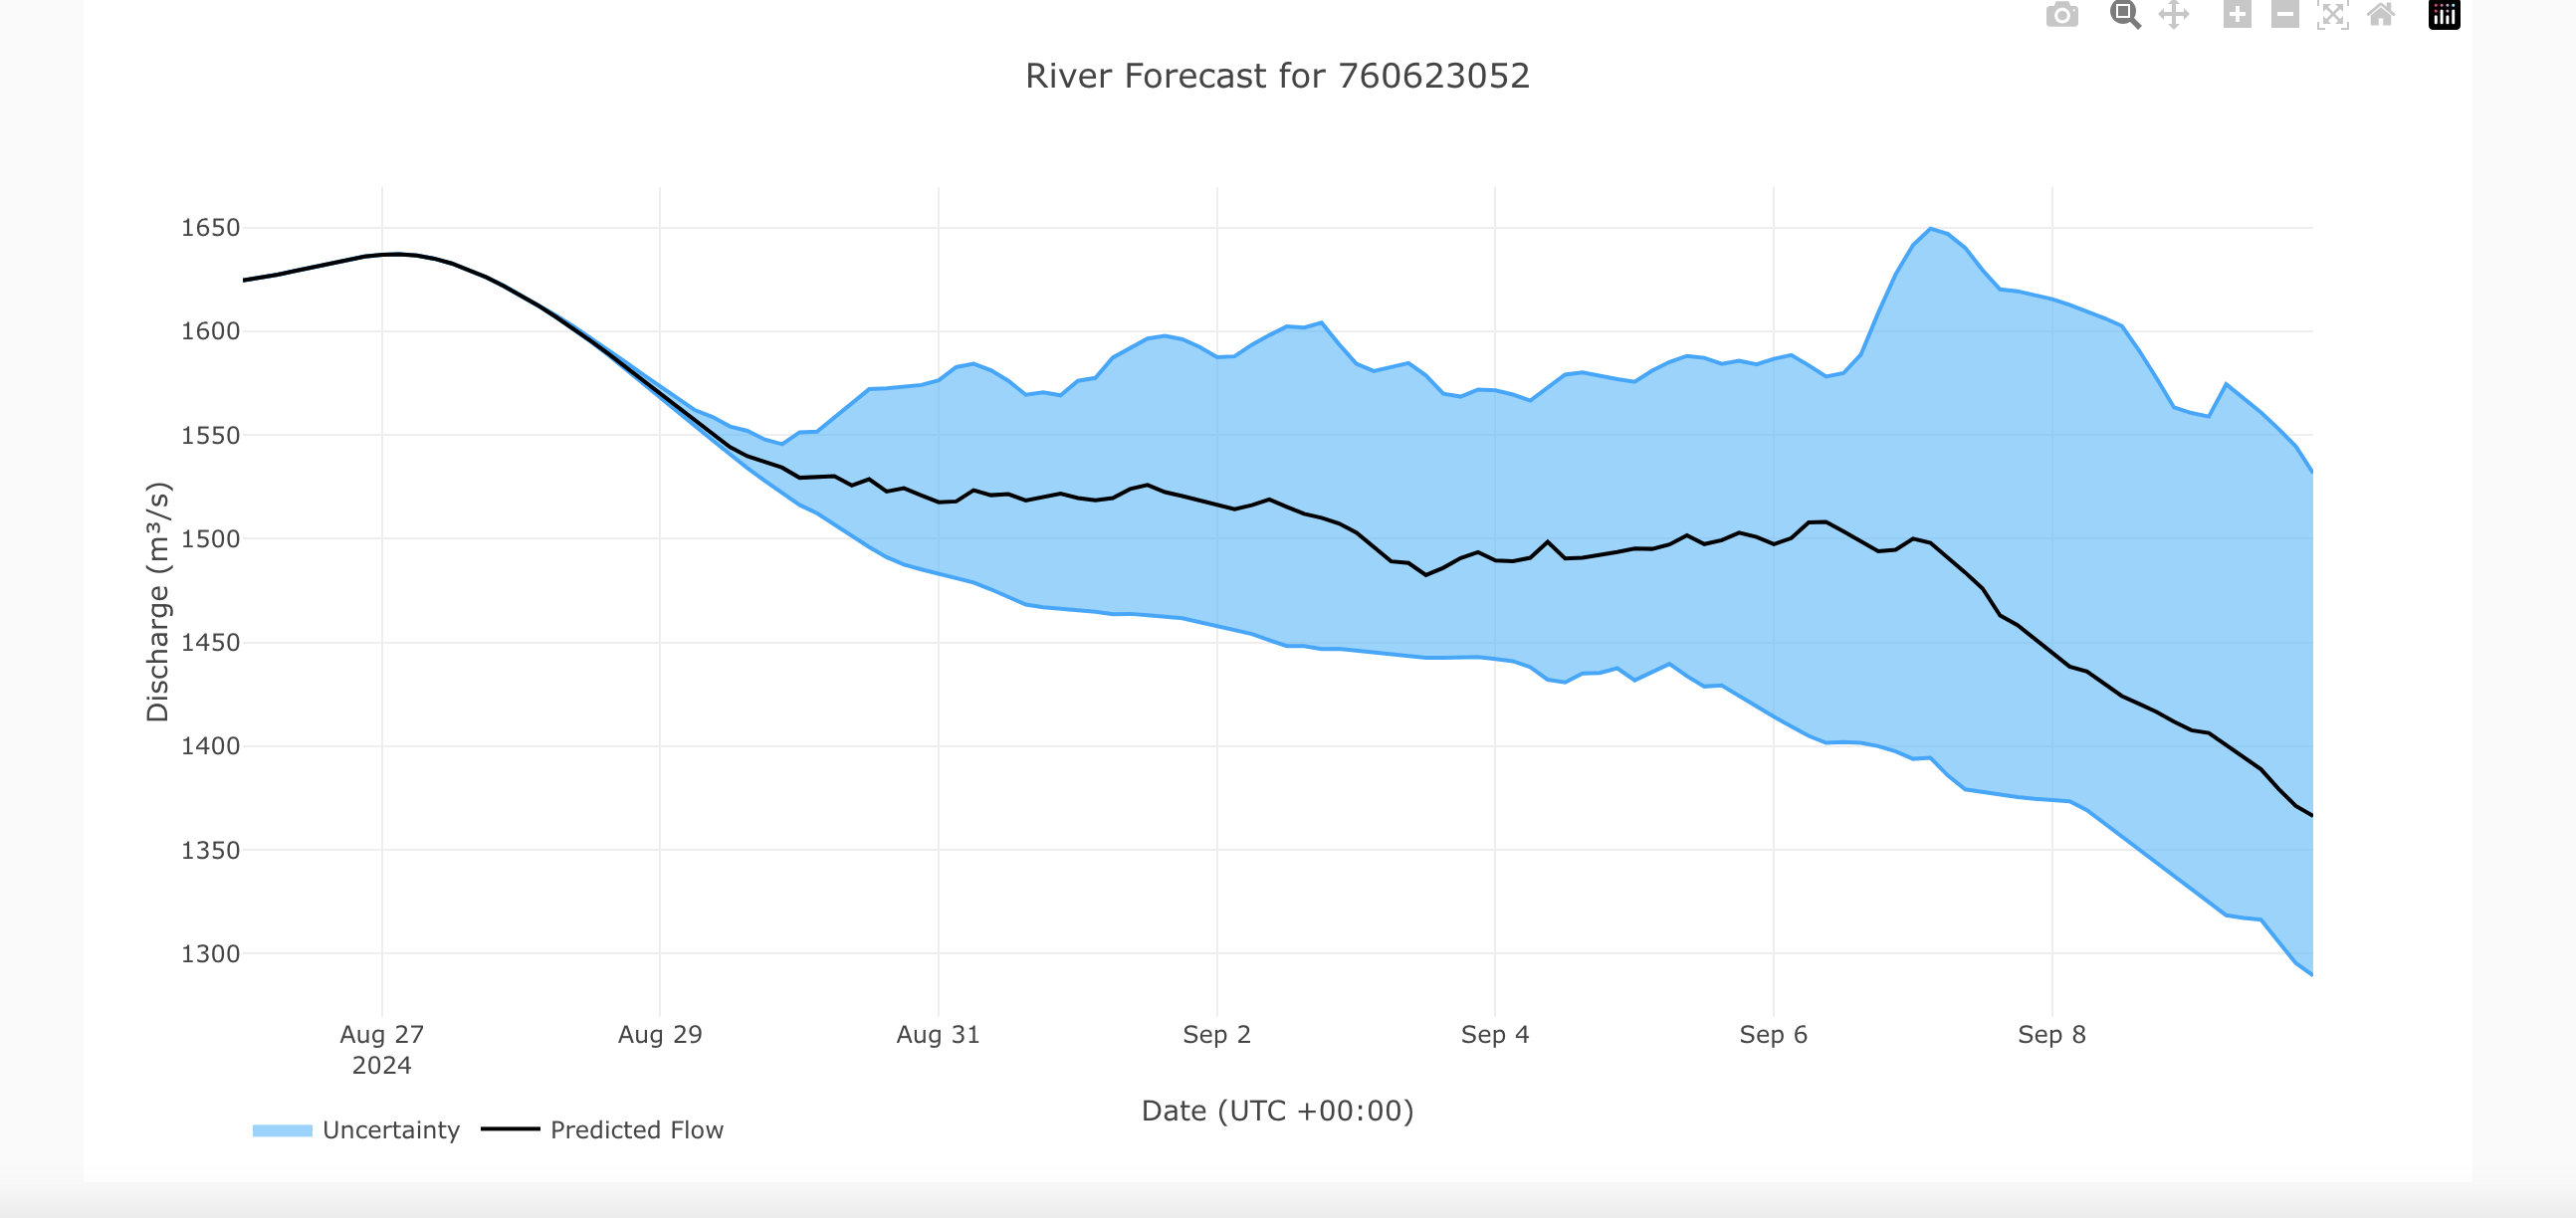
How to interpret this graph
1. The black line represents the best estimate of future river flow.
2. The blue shaded region represents the uncertainty in the prediction. The narrower the blue region, the more confident the model is. The true flow is more likely than not to fall within the blue shaded area.
For more details, refer to the document: Forecast_Data.pdf.