WHOs Water Data Explorer
In recent years, there has been a growing need for standardized ways of sharing water data on the web. In response, the Consortium of Universities for the Advancement of Hydrologic Science (CUAHSI) has developed the Hydrologic Information System (HIS) along with the standardized WaterOneFlow web services and WaterML data exchange format. Tools to access data shared to the WaterOneFlow services and WaterML already exist such as the Microsoft Windows HydroDesktop software, WaterML R package, and the web-based CUAHSI HydroClient which serves as an access point to the CUAHSI HIS database.
The Tethys Water Data Explorer (WDE) is a newly developed web-based tool allowing a broad range of users to discover, access, visualize, and download data from any Information System that makes available water data in WaterML format through WaterOneFlow services. WDE is designed in a way that allows users to customize it for local or regional web portals.
WHOs Water Data Explorer Presentation
Functionalities Demonstration
This demo will explain how to use the WDE functionalities as a regular user, without admin permissions. We will be using the “Test” Catalog, with views “Los Nevados” and “ParaN.” These views should be preloaded in the tethys staging portal.
When it comes to sorting through data you can use the  icon, this will open the Filter of Views menu.
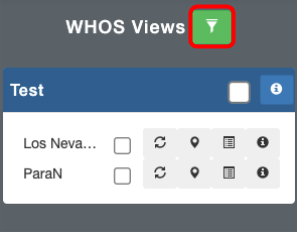
The Filter of Views menu allows users to filter by country and/or variable.
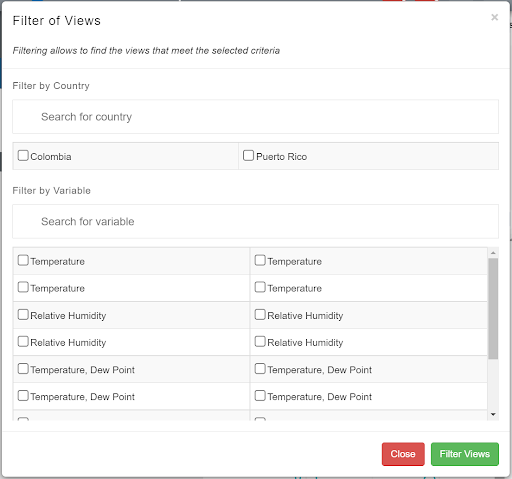
Select Puerto Rico from the Filter by Country tab and then click the green Filter Views button. It will then limit the views to views only in Puerto Rico, you can reset the filters by hitting the Reset button.
You will notice that next to the different views is a checkbox and four icons. These icons all have different functions.
The checkbox selects the views being displayed on the map. Click the checkbox next to the ParaN view, notice that some stations appear on the map in Puerto Rico.
The  icon refreshes the view it corresponds with, refreshing will add or remove points that have been added or
removed to the data since the last refresh. Go ahead and hit this icon, you should notice the WDE loading and after will
display a message indicating how many sites were changed.
icon refreshes the view it corresponds with, refreshing will add or remove points that have been added or
removed to the data since the last refresh. Go ahead and hit this icon, you should notice the WDE loading and after will
display a message indicating how many sites were changed.
Click the  icon next to the ParaN view, notice that it zooms into where the stations are on the map, this
button will zoom up close to whichever view it corresponds with.
icon next to the ParaN view, notice that it zooms into where the stations are on the map, this
button will zoom up close to whichever view it corresponds with.
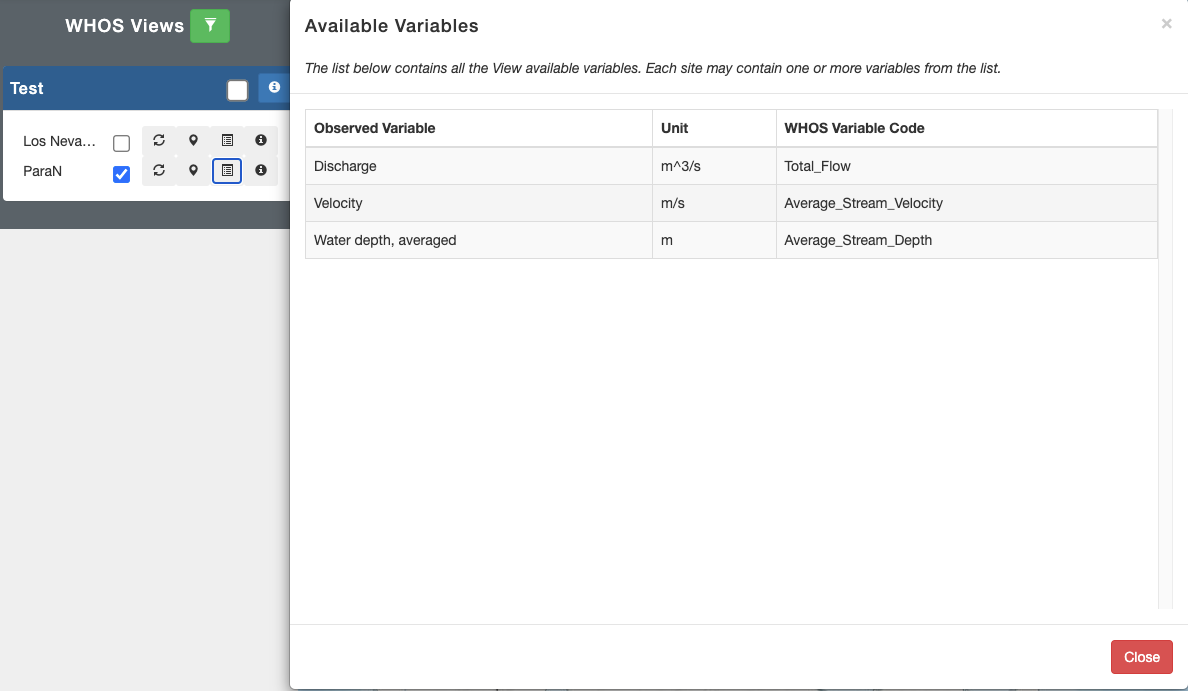
The  icon displays a list of available variables of the view. When you click on this icon next to the ParaN view,
it should display three variables: Discharge, Velocity, and Average Water Depth.
icon displays a list of available variables of the view. When you click on this icon next to the ParaN view,
it should display three variables: Discharge, Velocity, and Average Water Depth.
The  icon displays the information about a view, including the description, endpoint, list of stations, and the
available analysis tools.
icon displays the information about a view, including the description, endpoint, list of stations, and the
available analysis tools.
Select a station from the ParaN view, it will bring up a data tab below the map containing information about the station, including the variables included in the data.
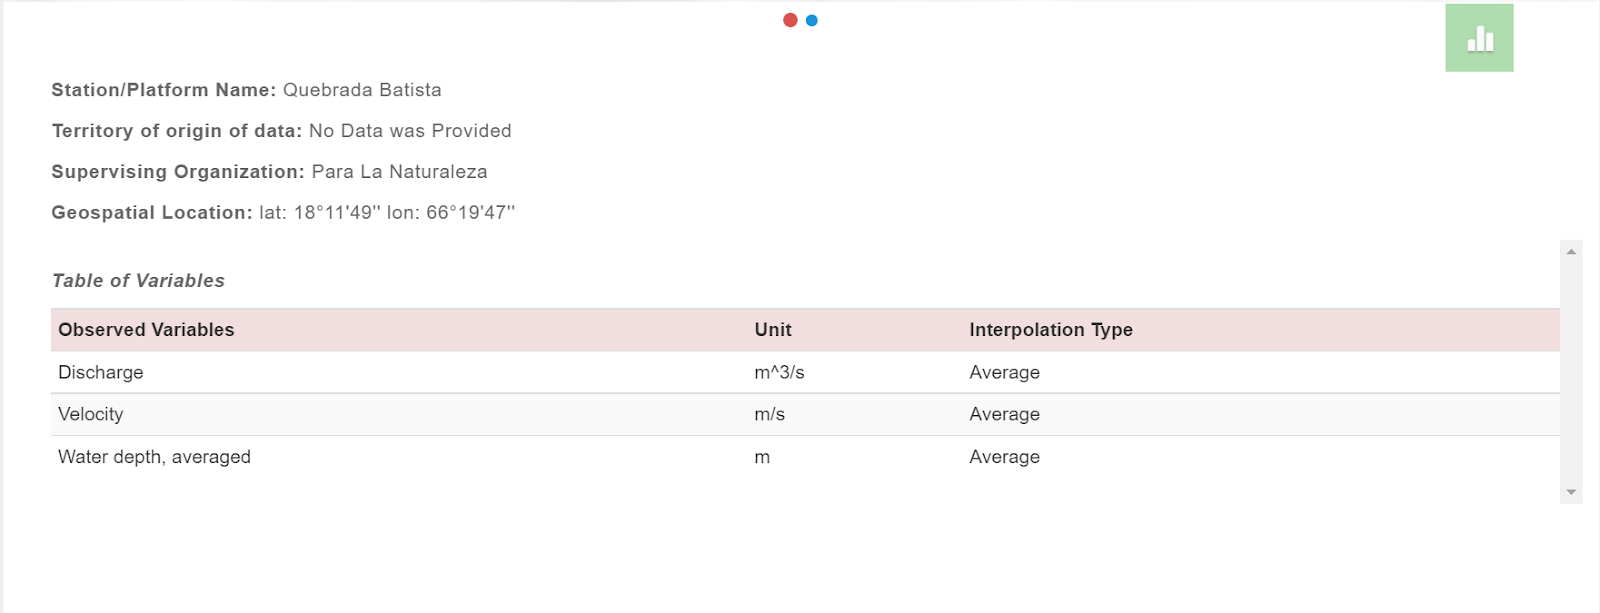
Hit the green graphing button, notice that the tab transitions to an empty graph. The Water Data Explorer will plot the time series for you. Click the blue Select Variable dropdown menu and select one of the variables. Then below the Select Variable menu are plotting options, you can choose between “Scatter” or “Whisker and Box” Plots.
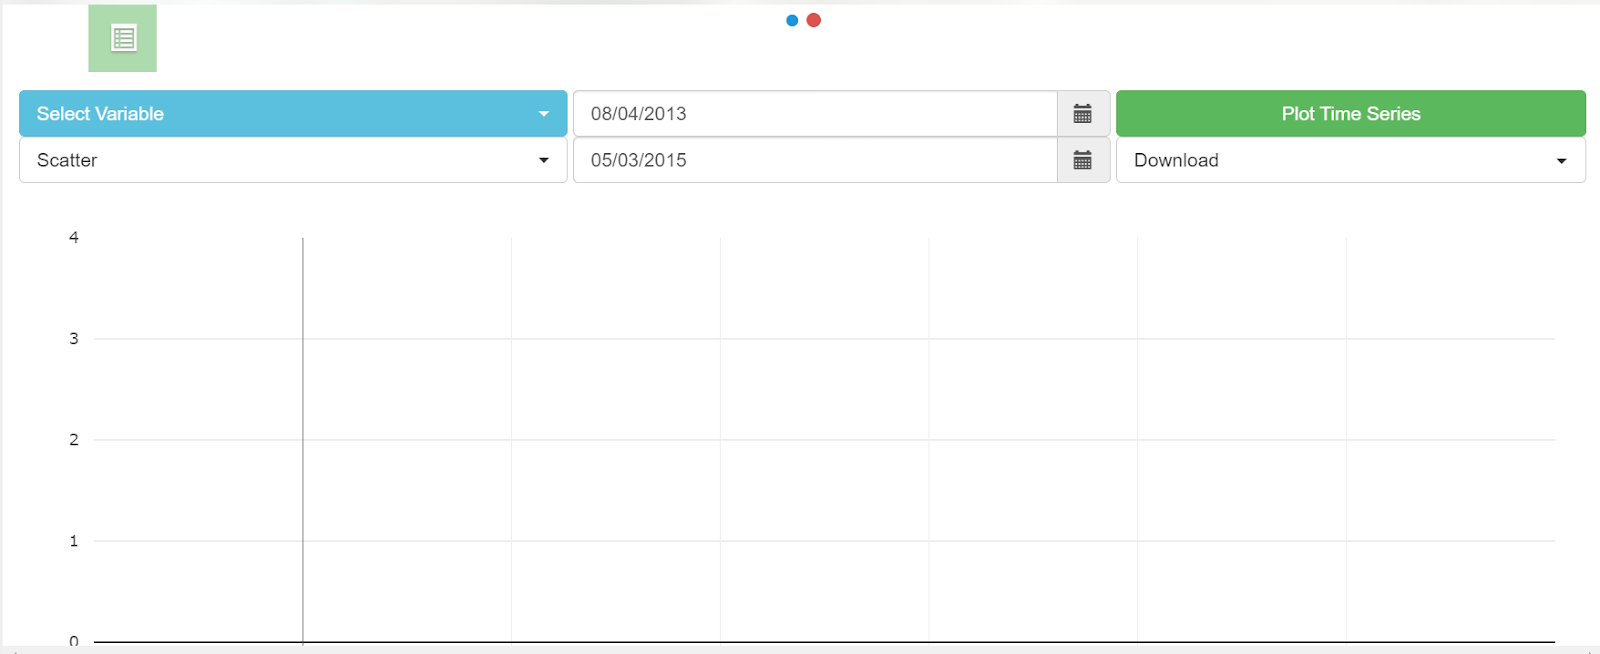
Once you choose a variable and plot type, hit the green Plot Time Series button and the WDE will then plot the time series in the graph below.
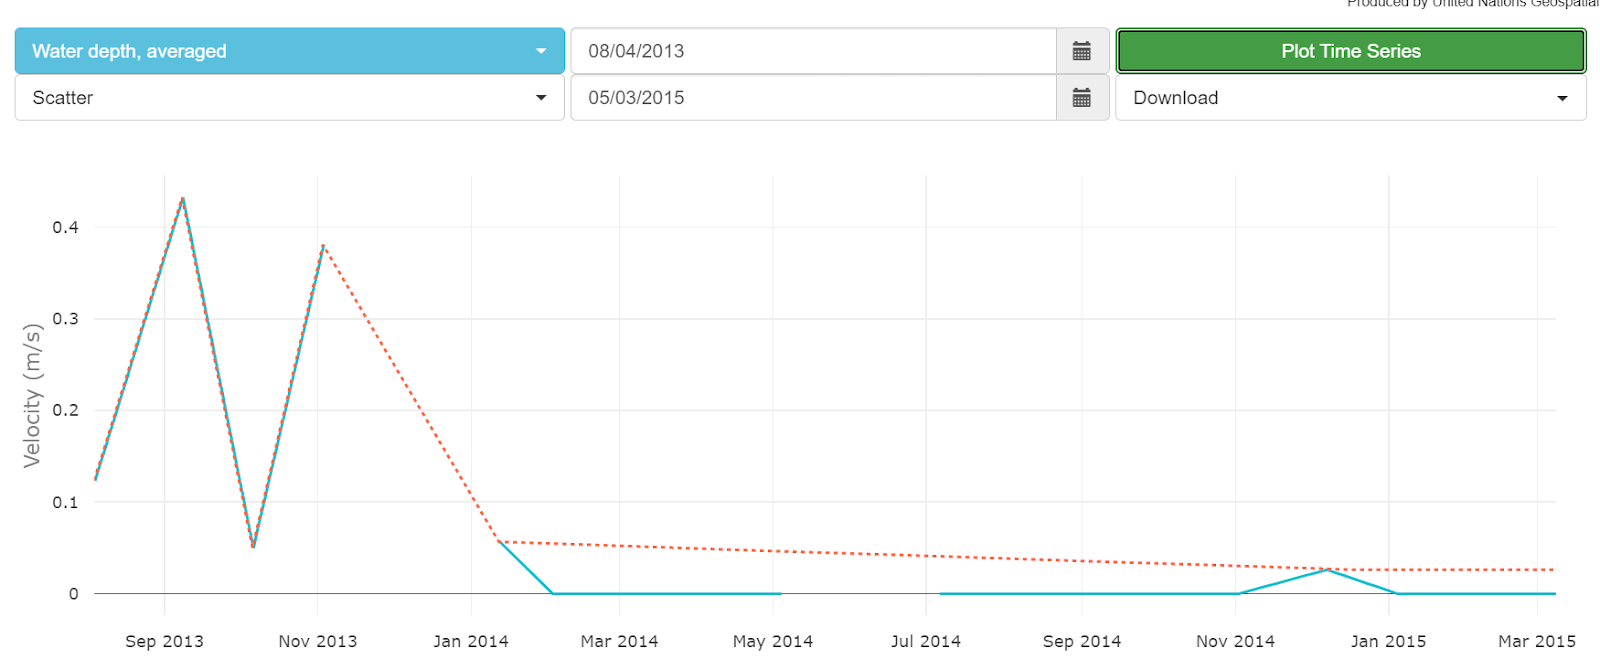
Below the Plot Time Series button is a download menu, this menu allows users to download the data to their local computer. When you click on it you will notice the different downloadable file types. For this time-series dataset you can only download CSV, Waterml 1.2, and Waterml 2.0. NetCDF is not available for any of the Cuahsi HIS Central Datasets.