Forecast Skill Evaluation
Introduction
The GEOGloWS ECMWF Streamflow Services (GESS) is a Global Streamflow Prediction Service that uses the ECMWF ensemble meteorological forecasting system, which consists of:
1 high-resolution member with spatial resolution of 9 km for 10 days. The temporal resolution for this high-resolution member is 1 hour for the first 4 days (days 1 – 4), 3 hours for the next 2 days (days 5-6), and 6 hours for the final 4 days (days 7-10).
51 members with a spatial resolution of 18 km for the first 10 days (days 1 – 10), and 36km for the next 5 days (days 11 to 15). The temporal resolution for these members is 3 hours for the first 6 days (days 1 – 6) and 6 hours for the next 9 days (days 7-15).
This ensemble is converted to surface runoff using the Hydrology Tiled ECMWF Scheme for Surface Exchanges over Land (HTESSEL) model. After that, an area-weighted grid-to-vector downscaling is performed for the runoff. GESS computes this cumulative runoff volume at each time step as an incremental contribution for each sub-basin. The Routing Application for Parallel computation of Discharge (RAPID) model is then used to route these inputs through the stream network (Qiao et al., 2019; Snow et al., 2016).
By comparing observed data with simulated forecasts for any flood event where the GESS model is available, it is possible to determine how accurately the forecast predicted a high flow event and how many days in advance the model captured the event. Previous results have shown that the GESS forecast can capture high flood events at least 5 days in advance. Unfortunately, the model cannot capture the flow regulations made by the hydraulic structures, or high floods due to local high-intensity precipitation events.
If you can get observed streamflow within a relatively short period of time after the flood event, you can follow the methods and workflow for evaluating the skill of forecasting from this presentation and workshop that includes some python workflows.
Validating Flood Events from GEOGloWS ECMWF Streamflow Services
This part of the workshop will show you how to validate the GEOGloWS ECMWF Streamflow Services short-term forecast in any flood event in any place in the world. You will compare observed data with simulated forecasts for a flood event to see how well the forecast performs.
Example data is provided to complete this workshop. If you would like to perform the validation for a different flood event, you will need:
The set of reach_ids which you want to use for the analysis.
The observed streamflow during the flood event corresponding to the set of reach_ids.
The record of forecasts starting at least 15 days before the flood event (the length of one forecast) to at least a couple of days after the event was finished.
Optional: The historical observed streamflow corresponding to the set of reach_ids.
Step 1: Get Forecast Record
The first step is getting the record of forecasts after a flood event has occurred.
This Google Colab notebook will allow you to download the forecast data: https://colab.research.google.com/drive/1y2eVRJpfcdISB25U0lCBZ7z6up14wswg
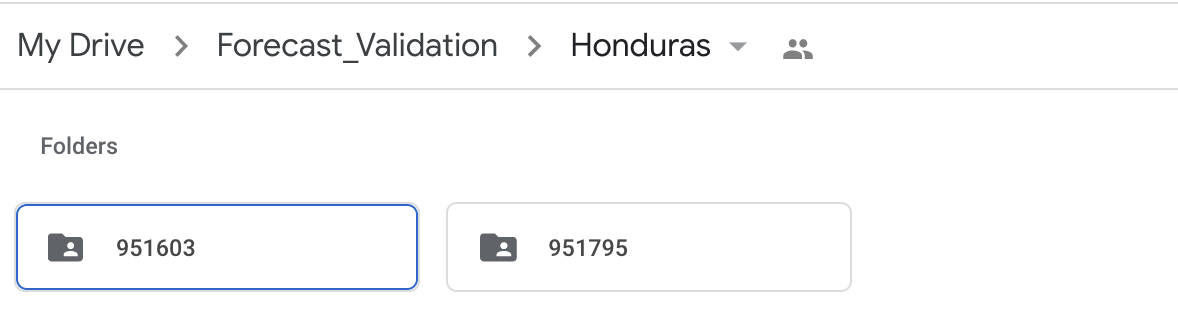
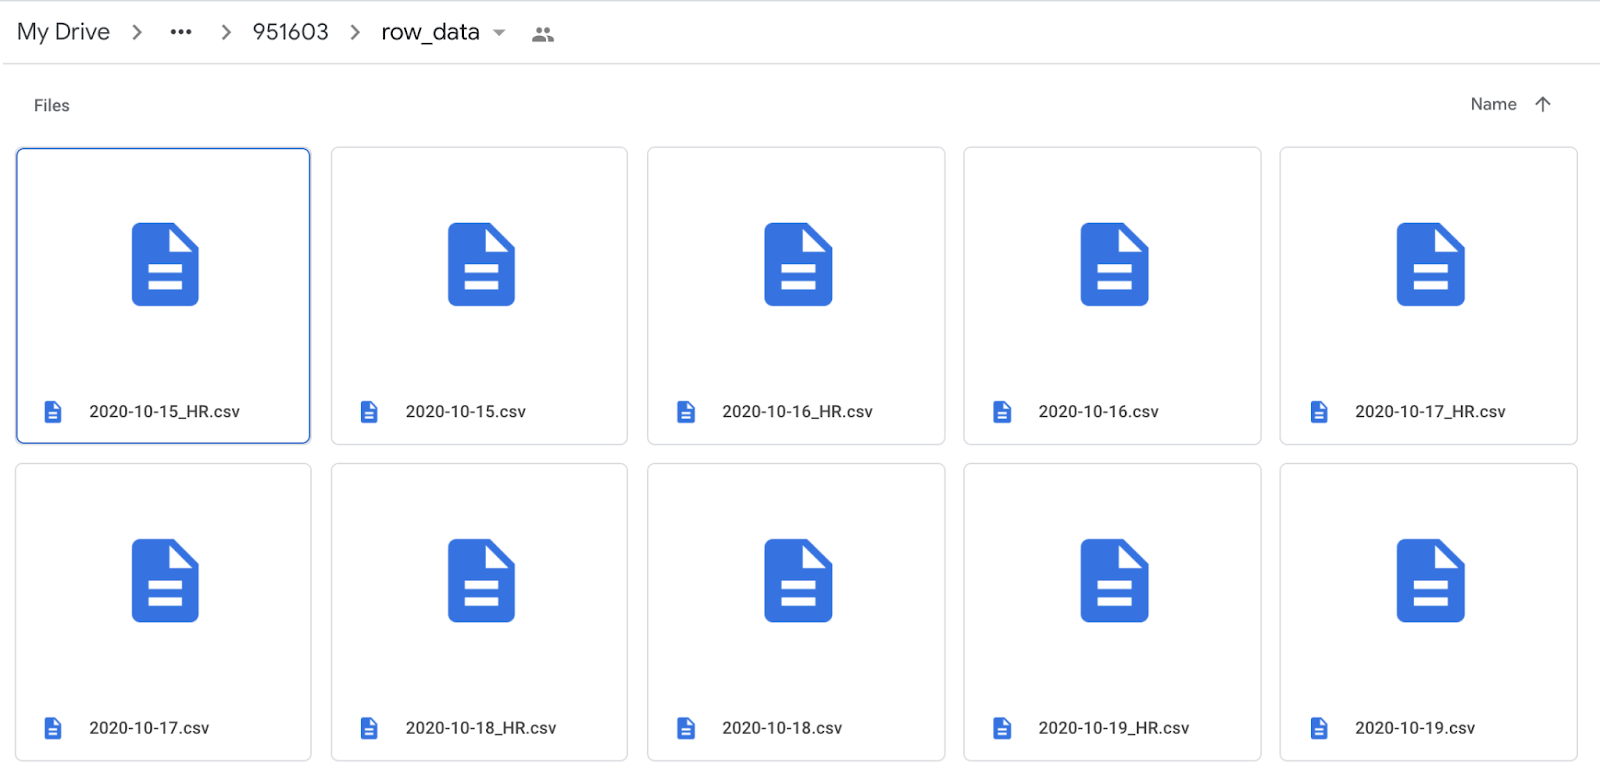
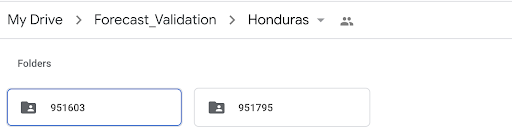
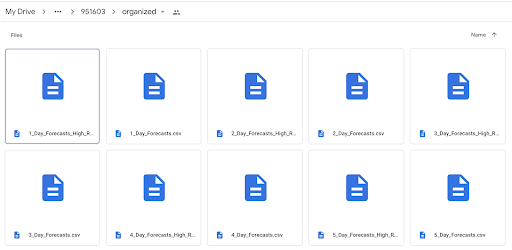
After running this notebook, you will find a folder in your Google Drive called ‘Forecast_Validation’ containing a folder for each of the reach_ids that you used. Within these folders is a file with the forecast for each day that a forecast was available.
For the example followed in this tutorial, you will need to use the forecast data available here:
Step 2: Compare Observed Data with Forecasts
The second step in validating the performance of the GESS forecast during flood events is comparing the observed values with the original forecast datasets. First, you will need to save the observed streamflow data for the high flow event of interest to your Google Drive in the correct format. All of the observed data should be in the folder on your Google Drive called ‘Forecast_Validation/Country/’ (for this example the country is Honduras, so it would be ‘Forecast_Validation/Honduras/’). The observed data file for each station should be named in this format: ‘{station name}_RT_Q_orig.csv’
The observed data files should be in the same format as the example file below. The left column should contain the datetime (format: yyyy-mm-dd hh:mm:ss) with the column header “Datetime.” The right column should contain streamflow with units of m3/s and the column header “Streamflow (m3/s).”
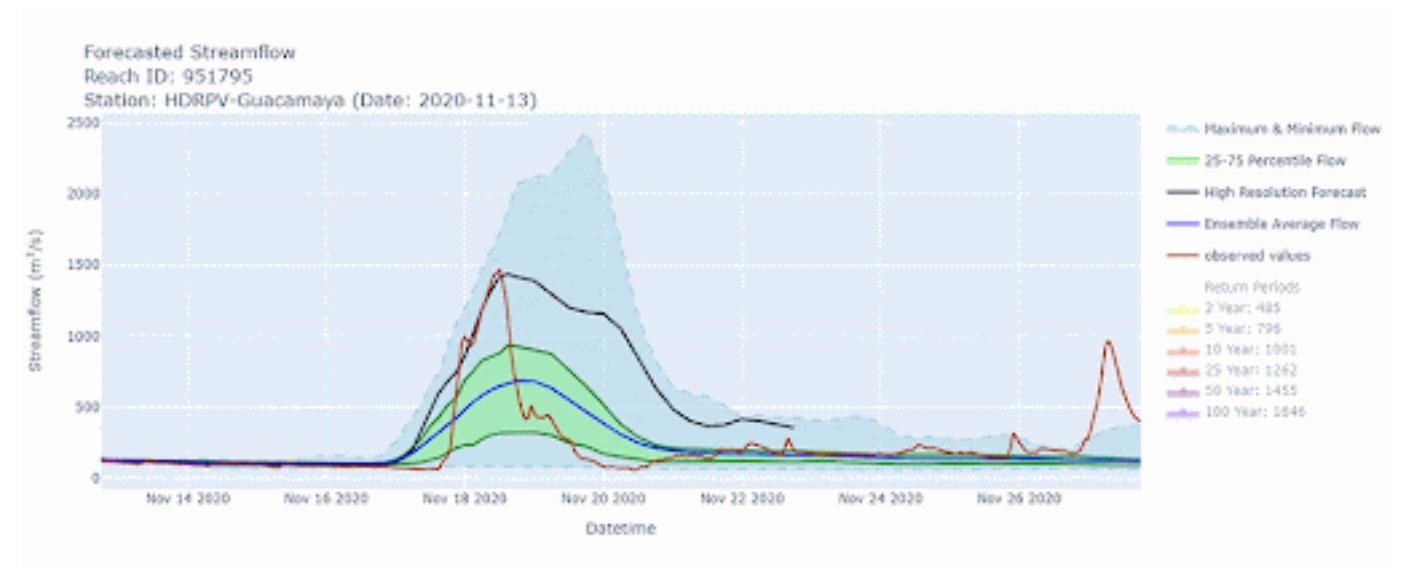
In this example we are following the GEOGloWS ECMWF Streamflow Services (GESS) Forecast Validation for the Eta and Iota Hurricanes in the stations HDRPV-Jicaro (951603) and HDRPV-Maragua (951795) in Honduras. The data needed for the example is available here:
The following Colab notebook will help to plot the original forecast launched every day and the observed data for the same datasets. The Colab notebook is available here: https://colab.research.google.com/drive/1VMs50wKE55TBn8tWTimc69s1rNaom8SI
Step 3: Reorganizing the Forecast Data
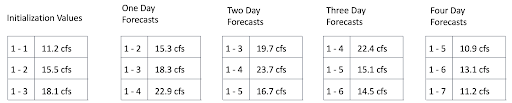
The third step is reorganizing the forecast as a function of days-in-advance. This will help us understand how far in advance the GEOGloWS ECMWF Streamflow Services forecasts accurately predict flow. Tables 1 and 2 illustrate how the data will be reorganized. After reorganizing the data, we can create visuals and compute metrics that show how accurate the forecasts are 1 day in advance, 2 days in advance, 3 days in advance, etc.
Table 1. Original forecast schema.
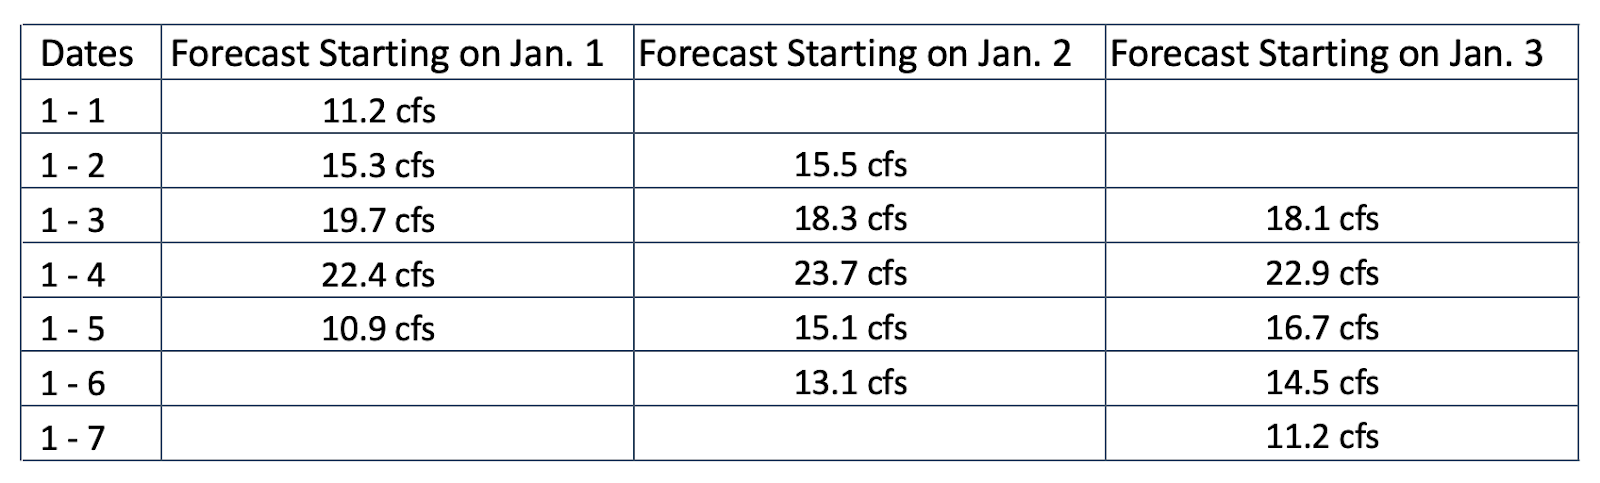
Table 2. Reorganized forecast data schema
You can do this by following this Google Colab notebook: https://colab.research.google.com/drive/1CDcKFNHyuZ2ropLVZBl8tU2GZCBB7WLA After running this Colab notebook, there will be a new folder inside the folder for each reach_id with the reorganized data.
Step 4: Comparing Days-in-Advance Forecasts with Observed Data
The fourth step in validating flood events is to do a visual analysis comparing every day in advance of the forecast with the observed data. The idea is to understand how many days in advance the GESS forecast was able to give us advice about the high flow event. This step requires the reorganized data from the previous step. This analysis can be done by following the Google Colab below, which evaluates 1-day to 15-day forecasts: https://colab.research.google.com/drive/1bRpO-cf3EOoSs_4oB0rZvQk8Jc6Avxo8